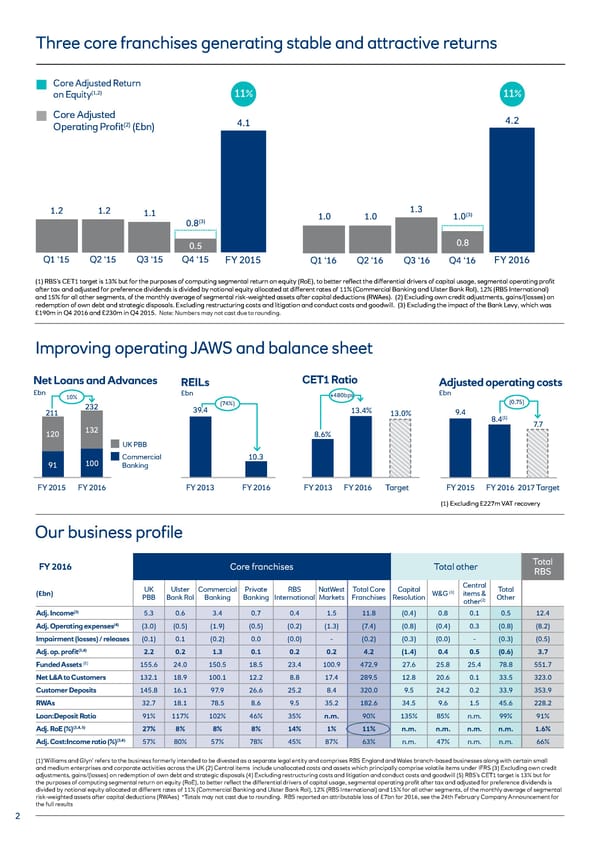
Three core franchises generating stable and attractive returns Core Adjusted Return on Equity(1,2) 11% 11% Core Adjusted 4.1 4.2 (2) Operating Profit (£bn) 1.2 1.2 1.1 1.0 1.0 1.3 1.0(3) 0.8(3) 0.5 0.8 Q1 ‘15 Q2 ‘15 Q3 ‘15 Q4 ‘15 FY 2015 Q1 ‘16 Q2 ‘16 Q3 ‘16 Q4 ‘16 FY 2016 (1) RBS’s CET1 target is 13% but for the purposes of computing segmental return on equity (RoE), to better reflect the differential drivers of capital usage, segmental operating profit after tax and adjusted for preference dividends is divided by notional equity allocated at different rates of 11% (Commercial Banking and Ulster Bank RoI), 12% (RBS International) and 15% for all other segments, of the monthly average of segmental risk-weighted assets after capital deductions (RWAes). (2) Excluding own credit adjustments, gains/(losses) on redemption of own debt and strategic disposals. Excluding restructuring costs and litigation and conduct costs and goodwill. (3) Excluding the impact of the Bank Levy, which was £190m in Q4 2016 and £230m in Q4 2015. Note: Numbers may not cast due to rounding. Improving operating JAWS and balance sheet Net Loans and Advances REILs CET1 Ratio Adjusted operating costs £bn 10% £bn +480bps £bn 232 (74%) (0.75) 211 39.4 13.4% 13.0% 9.4 (1) 8.4 7.7 120 132 8.6% UK PBB 100 Commercial 10.3 91 Banking FY 2015 FY 2016 FY 2013 FY 2016 FY 2013 FY 2016 Target FY 2015 FY 2016 2017 Target (1) Excluding £227m VAT recovery Our business profile FY 2016 Core franchises Total other Total RBS UK Ulster Commercial Private RBS NatWest Total Core Capital Central Total (£bn) (1) items & PBB Bank RoI Banking Banking International Markets Franchises Resolution W&G Other (2) other (3) 5.3 0.6 3.4 0.7 0.4 1.5 11.8 (0.4) 0.8 0.1 0.5 12.4 Adj. Income Adj. Operating expenses(4) (3.0) (0.5) (1.9) (0.5) (0.2) (1.3) (7.4) (0.8) (0.4) 0.3 (0.8) (8.2) Impairment (losses) / releases (0.1) 0.1 (0.2) 0.0 (0.0) - (0.2) (0.3) (0.0) - (0.3) (0.5) Adj. op. profit(3,4) 2.2 0.2 1.3 0.1 0.2 0.2 4.2 (1.4) 0.4 0.5 (0.6) 3.7 Funded Assets (5) 155.6 24.0 150.5 18.5 23.4 100.9 472.9 27.6 25.8 25.4 78.8 551.7 Net L&A to Customers 132.1 18.9 100.1 12.2 8.8 17.4 289.5 12.8 20.6 0.1 33.5 323.0 Customer Deposits 145.8 16.1 97.9 26.6 25.2 8.4 320.0 9.5 24.2 0.2 33.9 353.9 RWAs 32.7 18.1 78.5 8.6 9.5 35.2 182.6 34.5 9.6 1.5 45.6 228.2 Loan:Deposit Ratio 91% 117% 102% 46% 35% n.m. 90% 135% 85% n.m. 99% 91% Adj. RoE (%)(3,4, 5) 27% 8% 8% 8% 14% 1% 11% n.m. n.m. n.m. n.m. 1.6% Adj. Cost:Income ratio (%)(3,4) 57% 80% 57% 78% 45% 87% 63% n.m. 47% n.m. n.m. 66% (1)‘Williams and Glyn’ refers to the business formerly intended to be divested as a separate legal entity and comprises RBS England and Wales branch-based businesses along with certain small and medium enterprises and corporate activities across the UK (2) Central items include unallocated costs and assets which principally comprise volatile items under IFRS (3) Excluding own credit adjustments, gains/(losses) on redemption of own debt and strategic disposals (4) Excluding restructuring costs and litigation and conduct costs and goodwill (5) RBS’s CET1 target is 13% but for the purposes of computing segmental return on equity (RoE), to better reflect the differential drivers of capital usage, segmental operating profit after tax and adjusted for preference dividends is divided by notional equity allocated at different rates of 11% (Commercial Banking and Ulster Bank RoI), 12% (RBS International) and 15% for all other segments, of the monthly average of segmental risk-weighted assets after capital deductions (RWAes) *Totals may not cast due to rounding. RBS reported an attributable loss of £7bn for 2016, see the 24th February Company Announcement for the full results 2
 Investor Factbook Page 1 Page 3