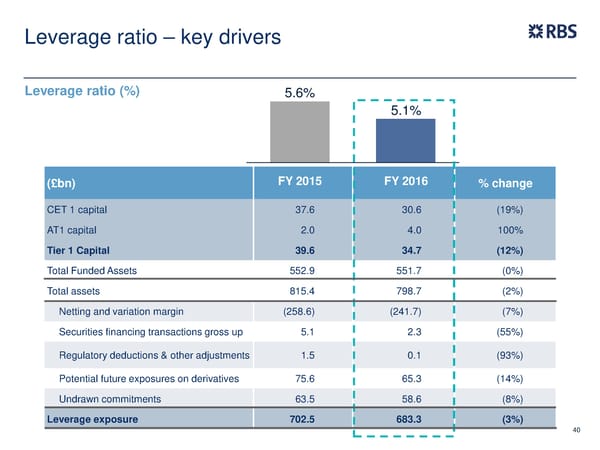
Leverage ratio – key drivers Leverage ratio (%) 5.6% 5.1% (£bn) FY 2015 FY 2016 % change CET 1 capital 37.6 30.6 (19%) AT1 capital 2.0 4.0 100% Tier 1 Capital 39.6 34.7 (12%) Total Funded Assets 552.9 551.7 (0%) Total assets 815.4 798.7 (2%) Netting and variation margin (258.6) (241.7) (7%) Securities financing transactions gross up 5.1 2.3 (55%) Regulatory deductions & other adjustments 1.5 0.1 (93%) Potential future exposures on derivatives 75.6 65.3 (14%) Undrawn commitments 63.5 58.6 (8%) Leverage exposure 702.5 683.3 (3%) 40
 FY Results | RBS Group Page 39 Page 41