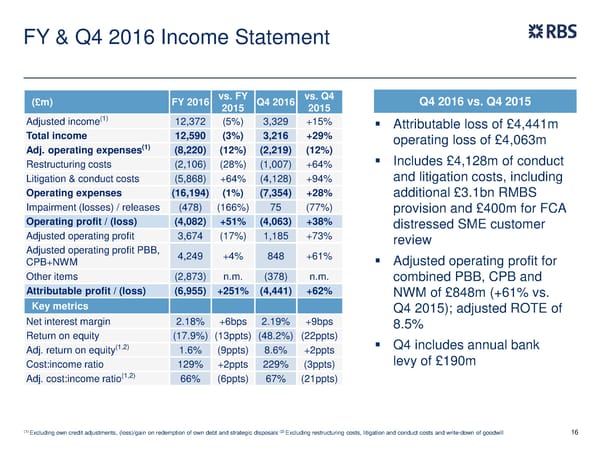
FY & Q4 2016 Income Statement (£m) FY 2016 vs. FY Q4 2016 vs. Q4 Q4 2016 vs. Q4 2015 2015 2015 (1) Adjusted income 12,372 (5%) 3,329 +15% Attributable loss of £4,441m Total income 12,590 (3%) 3,216 +29% operating loss of £4,063m (1) Adj. operating expenses (8,220) (12%) (2,219) (12%) Includes £4,128m of conduct Restructuring costs (2,106) (28%) (1,007) +64% and litigation costs, including Litigation & conduct costs (5,868) +64% (4,128) +94% Operating expenses (16,194) (1%) (7,354) +28% additional £3.1bn RMBS Impairment (losses) / releases (478) (166%) 75 (77%) provision and £400m for FCA Operating profit / (loss) (4,082) +51% (4,063) +38% distressed SME customer Adjusted operating profit 3,674 (17%) 1,185 +73% review Adjusted operating profit PBB, 4,249 +4% 848 +61% Adjusted operating profit for CPB+NWM Other items (2,873) n.m. (378) n.m. combined PBB, CPB and Attributable profit / (loss) (6,955) +251% (4,441) +62% NWM of £848m (+61% vs. Key metrics Q4 2015); adjusted ROTE of Net interest margin 2.18% +6bps 2.19% +9bps 8.5% Return on equity (17.9%) (13ppts) (48.2%) (22ppts) (1,2) Q4 includes annual bank Adj. return on equity 1.6% (9ppts) 8.6% +2ppts levy of £190m Cost:income ratio 129% +2ppts 229% (3ppts) Adj. cost:income ratio(1,2) 66% (6ppts) 67% (21ppts) (1) (2) 16 Excluding own credit adjustments, (loss)/gain on redemption of own debt and strategic disposals Excluding restructuring costs, litigation and conduct costs and write-down of goodwill
 FY Results | RBS Group Page 16 Page 18