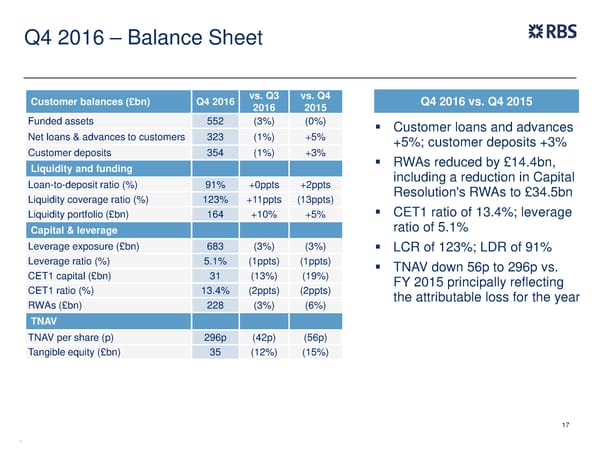
Q4 2016 – Balance Sheet Customer balances (£bn) Q4 2016 vs. Q3 vs. Q4 Q4 2016 vs. Q4 2015 2016 2015 Funded assets 552 (3%) (0%) Customer loans and advances Net loans & advances to customers 323 (1%) +5% +5%; customer deposits +3% Customer deposits 354 (1%) +3% RWAs reduced by £14.4bn, Liquidity and funding including a reduction in Capital Loan-to-deposit ratio (%) 91% +0ppts +2ppts Resolution's RWAs to £34.5bn Liquidity coverage ratio (%) 123% +11ppts (13ppts) CET1 ratio of 13.4%; leverage Liquidity portfolio (£bn) 164 +10% +5% ratio of 5.1% Capital & leverage Leverage exposure (£bn) 683 (3%) (3%) LCR of 123%; LDR of 91% Leverage ratio (%) 5.1% (1ppts) (1ppts) TNAV down 56p to 296p vs. CET1 capital (£bn) 31 (13%) (19%) FY 2015 principally reflecting CET1 ratio (%) 13.4% (2ppts) (2ppts) the attributable loss for the year RWAs (£bn) 228 (3%) (6%) TNAV TNAV per share (p) 296p (42p) (56p) Tangible equity (£bn) 35 (12%) (15%) 17 .
 FY Results | RBS Group Page 17 Page 19