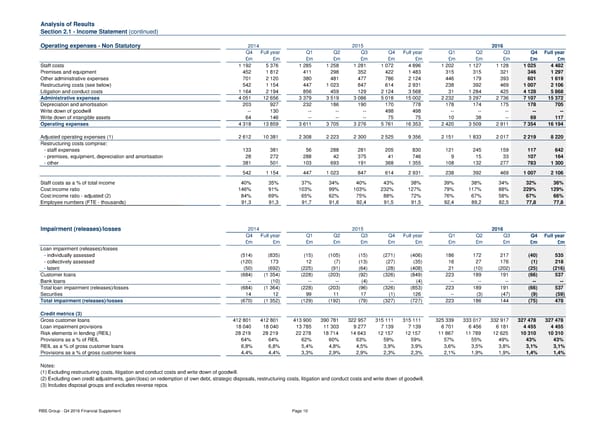
Analysis of Results Section 2.1 - Income Statement (continued) Operating expenses - Non Statutory 2014 2015 2016 Q4 Full year Q1 Q2 Q3 Q4 Full year Q1 Q2 Q3 Q4 Full year £m £m £m £m £m £m £m £m £m £m £m £m Staff costs 1 192 5 376 1 285 1 258 1 281 1 072 4 896 1 202 1 127 1 128 1 025 4 482 Premises and equipment 452 1 812 411 298 352 422 1 483 315 315 321 346 1 297 Other administrative expenses 701 2 120 380 481 477 786 2 124 446 179 393 601 1 619 Restructuring costs (see below) 542 1 154 447 1 023 847 614 2 931 238 392 469 1 007 2 106 Litigation and conduct costs 1 164 2 194 856 459 129 2 124 3 568 31 1 284 425 4 128 5 868 Administrative expenses 4 051 12 656 3 379 3 519 3 086 5 018 15 002 2 232 3 297 2 736 7 107 15 372 Depreciation and amortisation 203 927 232 186 190 170 778 178 174 175 178 705 Write down of goodwill -- 130 -- -- -- 498 498 -- -- -- -- -- Write down of intangible assets 64 146 -- -- -- 75 75 10 38 -- 69 117 Operating expenses 4 318 13 859 3 611 3 705 3 276 5 761 16 353 2 420 3 509 2 911 7 354 16 194 Adjusted operating expenses (1) 2 612 10 381 2 308 2 223 2 300 2 525 9 356 2 151 1 833 2 017 2 219 8 220 Restructuring costs comprise: - staff expenses 133 381 56 288 281 205 830 121 245 159 117 642 - premises, equipment, depreciation and amortisation 28 272 288 42 375 41 746 9 15 33 107 164 - other 381 501 103 693 191 368 1 355 108 132 277 783 1 300 542 1 154 447 1 023 847 614 2 931 238 392 469 1 007 2 106 Staff costs as a % of total income 40% 35% 37% 34% 40% 43% 38% 39% 38% 34% 32% 36% Cost:income ratio 146% 91% 103% 99% 103% 232% 127% 79% 117% 88% 229% 129% Cost:income ratio - adjusted (2) 84% 69% 65% 62% 75% 88% 72% 76% 67% 58% 67% 66% Employee numbers (FTE - thousands) 91,3 91,3 91,7 91,6 92,4 91,5 91,5 92,4 89,2 82,5 77,8 77,8 Impairment (releases)/losses 2014 2015 2016 Q4 Full year Q1 Q2 Q3 Q4 Full year Q1 Q2 Q3 Q4 Full year £m £m £m £m £m £m £m £m £m £m £m £m Loan impairment (releases)/losses - individually assessed (514) (835) (15) (105) (15) (271) (406) 186 172 217 (40) 535 - collectively assessed (120) 173 12 (7) (13) (27) (35) 16 27 176 (1) 218 - latent (50) (692) (225) (91) (64) (28) (408) 21 (10) (202) (25) (216) Customer loans (684) (1 354) (228) (203) (92) (326) (849) 223 189 191 (66) 537 Bank loans -- (10) -- -- (4) -- (4) -- -- -- -- -- Total loan impairment (releases)/losses (684) (1 364) (228) (203) (96) (326) (853) 223 189 191 (66) 537 Securities 14 12 99 11 17 (1) 126 -- (3) (47) (9) (59) Total impairment (releases)/losses (670) (1 352) (129) (192) (79) (327) (727) 223 186 144 (75) 478 Credit metrics (3) Gross customer loans 412 801 412 801 413 900 390 781 322 957 315 111 315 111 325 339 333 017 332 917 327 478 327 478 Loan impairment provisions 18 040 18 040 13 785 11 303 9 277 7 139 7 139 6 701 6 456 6 181 4 455 4 455 Risk elements in lending (REIL) 2 8 219 2 8 219 2 2 278 1 8 714 1 4 643 1 2 157 1 2 157 1 1 867 1 1 789 1 2 625 10 310 10 310 Provisions as a % of REIL 64% 64% 62% 60% 63% 59% 59% 57% 55% 49% 43% 43% REIL as a % of gross customer loans 6,8% 6,8% 5,4% 4,8% 4,5% 3,9% 3,9% 3,6% 3,5% 3,8% 3,1% 3,1% Provisions as a % of gross customer loans 4,4% 4,4% 3,3% 2,9% 2,9% 2,3% 2,3% 2,1% 1,9% 1,9% 1,4% 1,4% Notes: (1) Excluding restructuring costs, litigation and conduct costs and write down of goodwill. (2) Excluding own credit adjustments, gain/(loss) on redemption of own debt, strategic disposals, restructuring costs, litigation and conduct costs and write down of goodwill. (3) Includes disposal groups and excludes reverse repos. RBS Group - Q4 2016 Financial Supplement Page 10
 Financial Supplement Page 9 Page 11