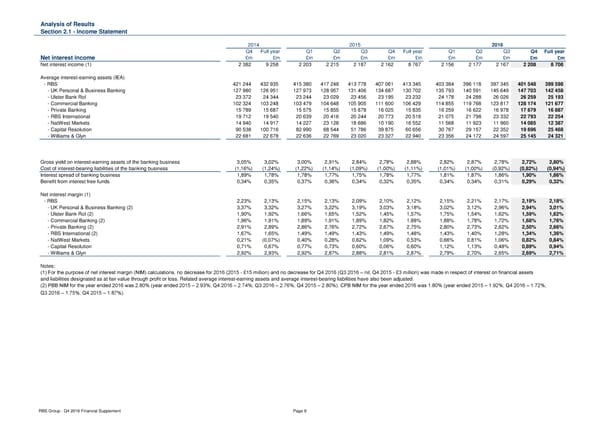
Analysis of Results Section 2.1 - Income Statement 2014 2015 2016 Q4 Full year Q1 Q2 Q3 Q4 Full year Q1 Q2 Q3 Q4 Full year Net interest income £m £m £m £m £m £m £m £m £m £m £m £m Net interest income (1) 2 382 9 258 2 203 2 215 2 187 2 162 8 767 2 156 2 177 2 167 2 208 8 708 Average interest-earning assets (IEA) - RBS 421 244 432 935 415 380 417 248 413 778 407 061 413 345 403 384 396 118 397 345 401 548 399 598 - UK Personal & Business Banking 127 980 126 951 127 973 128 957 131 406 134 687 130 702 135 793 140 591 145 649 147 703 142 458 - Ulster Bank RoI 23 372 24 344 23 244 23 029 23 456 23 195 23 232 24 178 24 288 26 026 26 259 25 193 - Commercial Banking 102 324 103 248 103 479 104 648 105 905 111 600 106 429 114 855 119 768 123 817 128 174 121 677 - Private Banking 15 789 15 687 15 575 15 855 15 878 16 025 15 835 16 259 16 622 16 978 17 679 16 887 - RBS International 19 712 19 540 20 639 20 416 20 244 20 773 20 518 21 075 21 798 23 332 22 793 22 254 - NatWest Markets 14 940 14 917 14 227 23 128 18 686 10 190 16 552 11 568 11 923 11 960 14 085 12 387 - Capital Resolution 90 538 100 716 82 990 68 544 51 786 39 875 60 656 30 767 29 157 22 352 19 696 25 468 - Williams & Glyn 22 681 22 678 22 636 22 769 23 020 23 327 22 940 23 356 24 172 24 597 25 145 24 321 Gross yield on interest-earning assets of the banking business 3,05% 3,02% 3,00% 2,91% 2,84% 2,78% 2,88% 2,82% 2,87% 2,78% 2,72% 2,80% Cost of interest-bearing liabilities of the banking business (1,16%) (1,24%) (1,22%) (1,14%) (1,09%) (1,00%) (1,11%) (1,01%) (1,00%) (0,92%) (0,82%) (0,94%) Interest spread of banking business 1,89% 1,78% 1,78% 1,77% 1,75% 1,78% 1,77% 1,81% 1,87% 1,86% 1,90% 1,86% Benefit from interest free funds 0,34% 0,35% 0,37% 0,36% 0,34% 0,32% 0,35% 0,34% 0,34% 0,31% 0,29% 0,32% Net interest margin (1) - RBS 2,23% 2,13% 2,15% 2,13% 2,09% 2,10% 2,12% 2,15% 2,21% 2,17% 2,19% 2,18% - UK Personal & Business Banking (2) 3,37% 3,32% 3,27% 3,22% 3,19% 3,03% 3,18% 3,02% 3,12% 2,96% 2,94% 3,01% - Ulster Bank RoI (2) 1,90% 1,92% 1,66% 1,65% 1,52% 1,45% 1,57% 1,75% 1,54% 1,62% 1,59% 1,62% - Commercial Banking (2) 1,96% 1,91% 1,89% 1,91% 1,89% 1,82% 1,88% 1,88% 1,78% 1,72% 1,68% 1,76% - Private Banking (2) 2,91% 2,89% 2,86% 2,76% 2,72% 2,67% 2,75% 2,80% 2,73% 2,62% 2,50% 2,66% - RBS International (2) 1,67% 1,65% 1,49% 1,49% 1,43% 1,49% 1,48% 1,43% 1,40% 1,28% 1,34% 1,36% - NatWest Markets 0,21% (0,07%) 0,40% 0,28% 0,62% 1,09% 0,53% 0,66% 0,81% 1,06% 0,82% 0,84% - Capital Resolution 0,71% 0,67% 0,77% 0,73% 0,60% 0,06% 0,60% 1,12% 1,13% 0,48% 0,89% 0,94% - Williams & Glyn 2,92% 2,93% 2,92% 2,87% 2,88% 2,81% 2,87% 2,79% 2,70% 2,65% 2,69% 2,71% Notes: (1) For the purpose of net interest margin (NIM) calculations, no decrease for 2016 (2015 - £15 million) and no decrease for Q4 2016 (Q3 2016 – nil; Q4 2015 - £3 million) was made in respect of interest on financial assets and liabilities designated as at fair value through profit or loss. Related average interest-earning assets and average interest-bearing liabilities have also been adjusted. (2) PBB NIM for the year ended 2016 was 2.80% (year ended 2015 – 2.93%; Q4 2016 – 2.74%; Q3 2016 – 2.76%; Q4 2015 – 2.80%). CPB NIM for the year ended 2016 was 1.80% (year ended 2015 – 1.92%; Q4 2016 – 1.72%; Q3 2016 – 1.75%; Q4 2015 – 1.87%). RBS Group - Q4 2016 Financial Supplement Page 9
 Financial Supplement Page 8 Page 10