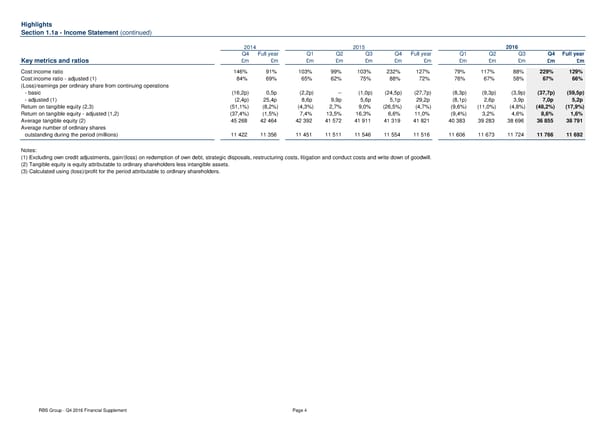
Highlights Section 1.1a - Income Statement (continued) 2014 2015 2016 Q4 Full year Q1 Q2 Q3 Q4 Full year Q1 Q2 Q3 Q4 Full year Key metrics and ratios £m £m £m £m £m £m £m £m £m £m £m £m Cost:income ratio 146% 91% 103% 99% 103% 232% 127% 79% 117% 88% 229% 129% Cost:income ratio - adjusted (1) 84% 69% 65% 62% 75% 88% 72% 76% 67% 58% 67% 66% (Loss)/earnings per ordinary share from continuing operations - basic (16,2p) 0,5p (2,2p) -- (1,0p) (24,5p) (27,7p) (8,3p) (9,3p) (3,9p) (37,7p) (59,5p) - adjusted (1) (2,4p) 25,4p 8,6p 9,9p 5,6p 5,1p 29,2p (8,1p) 2,6p 3,9p 7,0p 5,2p Return on tangible equity (2,3) (51,1%) (8,2%) (4,3%) 2,7% 9,0% (26,5%) (4,7%) (9,6%) (11,0%) (4,8%) (48,2%) (17,9%) Return on tangible equity - adjusted (1,2) (37,4%) (1,5%) 7,4% 13,5% 16,3% 6,6% 11,0% (9,4%) 3,2% 4,6% 8,6% 1,6% Average tangible equity (2) 45 268 42 464 42 392 41 572 41 911 41 319 41 821 40 383 39 283 38 696 36 855 38 791 Average number of ordinary shares outstanding during the period (millions) 11 422 11 356 11 451 11 511 11 546 11 554 11 516 11 606 11 673 11 724 11 766 11 692 Notes: (1) Excluding own credit adjustments, gain/(loss) on redemption of own debt, strategic disposals, restructuring costs, litigation and conduct costs and write down of goodwill. (2) Tangible equity is equity attributable to ordinary shareholders less intangible assets. (3) Calculated using (loss)/profit for the period attributable to ordinary shareholders. RBS Group - Q4 2016 Financial Supplement Page 4
 Financial Supplement Page 3 Page 5