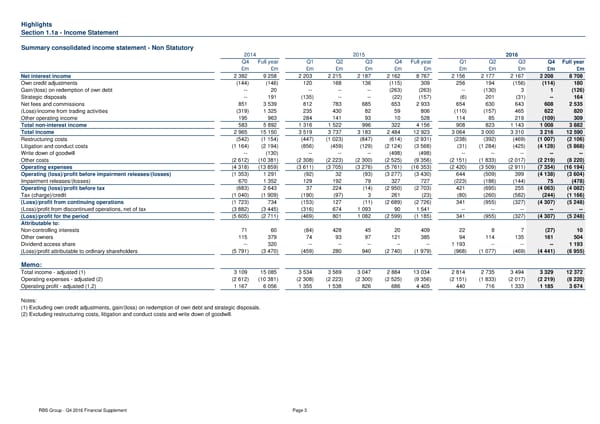
Highlights Section 1.1a - Income Statement Summary consolidated income statement - Non Statutory 2014 2015 2016 Q4 Full year Q1 Q2 Q3 Q4 Full year Q1 Q2 Q3 Q4 Full year £m £m £m £m £m £m £m £m £m £m £m £m Net interest income 2 382 9 258 2 203 2 215 2 187 2 162 8 767 2 156 2 177 2 167 2 208 8 708 Own credit adjustments (144) (146) 120 168 136 (115) 309 256 194 (156) (114) 180 Gain/(loss) on redemption of own debt -- 20 -- -- -- (263) (263) -- (130) 3 1 (126) Strategic disposals -- 191 (135) -- -- (22) (157) (6) 201 (31) -- 164 Net fees and commissions 851 3 539 812 783 685 653 2 933 654 630 643 608 2 535 (Loss)/income from trading activities (319) 1 325 235 430 82 59 806 (110) (157) 465 622 820 Other operating income 195 963 284 141 93 10 528 114 85 219 (109) 309 Total non-interest income 583 5 892 1 316 1 522 996 322 4 156 908 823 1 143 1 008 3 882 Total income 2 965 15 150 3 519 3 737 3 183 2 484 12 923 3 064 3 000 3 310 3 216 12 590 Restructuring costs (542) (1 154) (447) (1 023) (847) (614) (2 931) (238) (392) (469) (1 007) (2 106) Litigation and conduct costs (1 164) (2 194) (856) (459) (129) (2 124) (3 568) (31) (1 284) (425) (4 128) (5 868) Write down of goodwill -- (130) -- -- -- (498) (498) -- -- -- -- -- Other costs (2 612) (10 381) (2 308) (2 223) (2 300) (2 525) (9 356) (2 151) (1 833) (2 017) (2 219) (8 220) Operating expenses (4 318) (13 859) (3 611) (3 705) (3 276) (5 761) (16 353) (2 420) (3 509) (2 911) (7 354) (16 194) Operating (loss)/profit before impairment releases/(losses) (1 353) 1 291 (92) 32 (93) (3 277) (3 430) 644 (509) 399 (4 138) (3 604) Impairment releases/(losses) 670 1 352 129 192 79 327 727 (223) (186) (144) 75 (478) Operating (loss)/profit before tax (683) 2 643 37 224 (14) (2 950) (2 703) 421 (695) 255 (4 063) (4 082) Tax (charge)/credit (1 040) (1 909) (190) (97) 3 261 (23) (80) (260) (582) (244) (1 166) (Loss)/profit from continuing operations (1 723) 734 (153) 127 (11) (2 689) (2 726) 341 (955) (327) (4 307) (5 248) (Loss)/profit from discontinued operations, net of tax (3 882) (3 445) (316) 674 1 093 90 1 541 -- -- -- -- -- (Loss)/profit for the period (5 605) (2 711) (469) 801 1 082 (2 599) (1 185) 341 (955) (327) (4 307) (5 248) Attributable to: Non-controlling interests 71 60 (84) 428 45 20 409 22 8 7 (27) 10 Other owners 115 379 74 93 97 121 385 94 114 135 161 504 Dividend access share -- 320 -- -- -- -- -- 1 193 -- -- -- 1 193 (Loss)/profit attributable to ordinary shareholders (5 791) (3 470) (459) 280 940 (2 740) (1 979) (968) (1 077) (469) (4 441) (6 955) Memo: Total income - adjusted (1) 3 109 15 085 3 534 3 569 3 047 2 884 13 034 2 814 2 735 3 494 3 329 12 372 Operating expenses - adjusted (2) (2 612) (10 381) (2 308) (2 223) (2 300) (2 525) (9 356) (2 151) (1 833) (2 017) (2 219) (8 220) Operating profit - adjusted (1,2) 1 167 6 056 1 355 1 538 826 686 4 405 440 716 1 333 1 185 3 674 Notes: (1) Excluding own credit adjustments, gain/(loss) on redemption of own debt and strategic disposals. (2) Excluding restructuring costs, litigation and conduct costs and write down of goodwill. RBS Group - Q4 2016 Financial Supplement Page 3
 Financial Supplement Page 2 Page 4