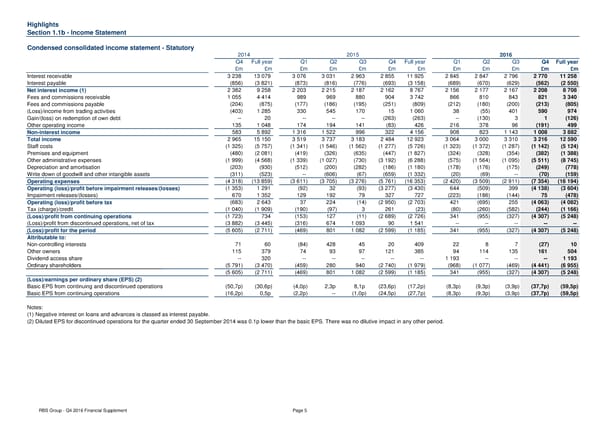
Highlights Section 1.1b - Income Statement Condensed consolidated income statement - Statutory 2014 2015 2016 Q4 Full year Q1 Q2 Q3 Q4 Full year Q1 Q2 Q3 Q4 Full year £m £m £m £m £m £m £m £m £m £m £m £m Interest receivable 3 238 13 079 3 076 3 031 2 963 2 855 11 925 2 845 2 847 2 796 2 770 11 258 Interest payable (856) (3 821) (873) (816) (776) (693) (3 158) (689) (670) (629) (562) (2 550) Net interest income (1) 2 382 9 258 2 203 2 215 2 187 2 162 8 767 2 156 2 177 2 167 2 208 8 708 Fees and commissions receivable 1 055 4 414 989 969 880 904 3 742 866 810 843 821 3 340 Fees and commissions payable (204) (875) (177) (186) (195) (251) (809) (212) (180) (200) (213) (805) (Loss)/income from trading activities (403) 1 285 330 545 170 15 1 060 38 (55) 401 590 974 Gain/(loss) on redemption of own debt -- 20 -- -- -- (263) (263) -- (130) 3 1 (126) Other operating income 135 1 048 174 194 141 (83) 426 216 378 96 (191) 499 Non-interest income 583 5 892 1 316 1 522 996 322 4 156 908 823 1 143 1 008 3 882 Total income 2 965 15 150 3 519 3 737 3 183 2 484 12 923 3 064 3 000 3 310 3 216 12 590 Staff costs (1 325) (5 757) (1 341) (1 546) (1 562) (1 277) (5 726) (1 323) (1 372) (1 287) (1 142) (5 124) Premises and equipment (480) (2 081) (419) (326) (635) (447) (1 827) (324) (328) (354) (382) (1 388) Other administrative expenses (1 999) (4 568) (1 339) (1 027) (730) (3 192) (6 288) (575) (1 564) (1 095) (5 511) (8 745) Depreciation and amortisation (203) (930) (512) (200) (282) (186) (1 180) (178) (176) (175) (249) (778) Write down of goodwill and other intangible assets (311) (523) -- (606) (67) (659) (1 332) (20) (69) -- (70) (159) Operating expenses (4 318) (13 859) (3 611) (3 705) (3 276) (5 761) (16 353) (2 420) (3 509) (2 911) (7 354) (16 194) Operating (loss)/profit before impairment releases/(losses) (1 353) 1 291 (92) 32 (93) (3 277) (3 430) 644 (509) 399 (4 138) (3 604) Impairment releases/(losses) 670 1 352 129 192 79 327 727 (223) (186) (144) 75 (478) Operating (loss)/profit before tax (683) 2 643 37 224 (14) (2 950) (2 703) 421 (695) 255 (4 063) (4 082) Tax (charge)/credit (1 040) (1 909) (190) (97) 3 261 (23) (80) (260) (582) (244) (1 166) (Loss)/profit from continuing operations (1 723) 734 (153) 127 (11) (2 689) (2 726) 341 (955) (327) (4 307) (5 248) (Loss)/profit from discontinued operations, net of tax (3 882) (3 445) (316) 674 1 093 90 1 541 -- -- -- -- -- (Loss)/profit for the period (5 605) (2 711) (469) 801 1 082 (2 599) (1 185) 341 (955) (327) (4 307) (5 248) Attributable to: Non-controlling interests 71 60 (84) 428 45 20 409 22 8 7 (27) 10 Other owners 115 379 74 93 97 121 385 94 114 135 161 504 Dividend access share -- 320 -- -- -- -- -- 1 193 -- -- -- 1 193 Ordinary shareholders (5 791) (3 470) (459) 280 940 (2 740) (1 979) (968) (1 077) (469) (4 441) (6 955) (5 605) (2 711) (469) 801 1 082 (2 599) (1 185) 341 (955) (327) (4 307) (5 248) (Loss)/earnings per ordinary share (EPS) (2) Basic EPS from continuing and discontinued operations (50,7p) (30,6p) (4,0p) 2,3p 8,1p (23,6p) (17,2p) (8,3p) (9,3p) (3,9p) (37,7p) (59,5p) Basic EPS from continuing operations (16,2p) 0,5p (2,2p) -- (1,0p) (24,5p) (27,7p) (8,3p) (9,3p) (3,9p) (37,7p) (59,5p) Notes: (1) Negative interest on loans and advances is classed as interest payable. (2) Diluted EPS for discontinued operations for the quarter ended 30 September 2014 was 0.1p lower than the basic EPS. There was no dilutive impact in any other period. RBS Group - Q4 2016 Financial Supplement Page 5
 Financial Supplement Page 4 Page 6