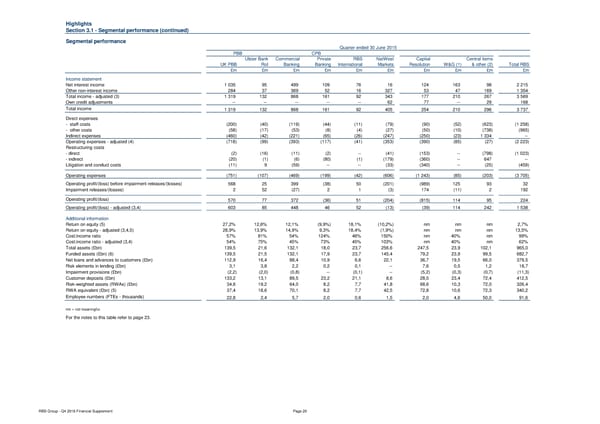
Highlights Section 3.1 - Segmental performance (continued) Segmental performance Quarter ended 30 June 2015 PBB CPB Ulster Bank Commercial Private RBS NatWest Capital Central items UK PBB RoI Banking Banking International Markets Resolution W&G (1) & other (2) Total RBS £m £m £m £m £m £m £m £m £m £m Income statement Net interest income 1 035 95 499 109 76 16 124 163 98 2 215 Other non-interest income 284 37 369 52 16 327 53 47 169 1 354 Total income - adjusted (3) 1 319 132 868 161 92 343 177 210 267 3 569 Own credit adjustments -- -- -- -- -- 62 77 -- 29 168 Total income 1 319 132 868 161 92 405 254 210 296 3 737 Direct expenses - staff costs (200) (40) (119) (44) (11) (79) (90) (52) (623) (1 258) - other costs (58) (17) (53) (8) (4) (27) (50) (10) (738) (965) Indirect expenses (460) (42) (221) (65) (26) (247) (250) (23) 1 334 -- Operating expenses - adjusted (4) (718) (99) (393) (117) (41) (353) (390) (85) (27) (2 223) Restructuring costs - direct (2) (16) (11) (2) -- (41) (153) -- (798) (1 023) - indirect (20) (1) (6) (80) (1) (179) (360) -- 647 -- Litigation and conduct costs (11) 9 (59) -- -- (33) (340) -- (25) (459) Operating expenses (751) (107) (469) (199) (42) (606) (1 243) (85) (203) (3 705) Operating profit/(loss) before impairment releases/(losses) 568 25 399 (38) 50 (201) (989) 125 93 32 Impairment releases/(losses) 2 52 (27) 2 1 (3) 174 (11) 2 192 Operating profit/(loss) 570 77 372 (36) 51 (204) (815) 114 95 224 Operating profit/(loss) - adjusted (3,4) 603 85 448 46 52 (13) (39) 114 242 1 538 Additional information Return on equity (5) 27,2% 12,6% 12,1% (9,9%) 18,1% (10,2%) nm nm nm 2,7% Return on equity - adjusted (3,4,5) 28,9% 13,9% 14,9% 9,3% 18,4% (1,9%) nm nm nm 13,5% Cost:income ratio 57% 81% 54% 124% 46% 150% nm 40% nm 99% Cost:income ratio - adjusted (3,4) 54% 75% 45% 73% 45% 103% nm 40% nm 62% Total assets (£bn) 139,5 21,6 132,1 18,0 23,7 256,6 247,5 23,9 102,1 965,0 Funded assets (£bn) (6) 139,5 21,5 132,1 17,9 23,7 145,4 79,2 23,9 99,5 682,7 Net loans and advances to customers (£bn) 112,9 16,4 88,4 10,9 6,6 22,1 36,7 19,5 66,0 379,5 Risk elements in lending (£bn) 3,1 3,8 2,2 0,2 0,1 -- 7,6 0,5 1,2 18,7 Impairment provisions (£bn) (2,2) (2,0) (0,8) -- (0,1) -- (5,2) (0,3) (0,7) (11,3) Customer deposits (£bn) 133,2 13,1 89,5 23,2 21,1 8,6 28,0 23,4 72,4 412,5 Risk-weighted assets (RWAs) (£bn) 34,6 19,2 64,0 8,2 7,7 41,8 68,6 10,3 72,0 326,4 RWA equivalent (£bn) (5) 37,4 18,6 70,1 8,2 7,7 42,5 72,8 10,6 72,3 340,2 Employee numbers (FTEs - thousands) 22,8 2,4 5,7 2,0 0,6 1,5 2,0 4,6 50,0 91,6 nm = not meaningful. For the notes to this table refer to page 23. RBS Group - Q4 2016 Financial Supplement Page 20
 Financial Supplement Page 19 Page 21