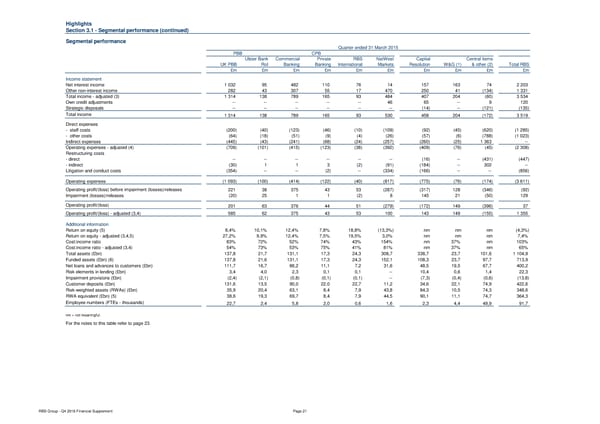
Highlights Section 3.1 - Segmental performance (continued) Segmental performance Quarter ended 31 March 2015 PBB CPB Ulster Bank Commercial Private RBS NatWest Capital Central items UK PBB RoI Banking Banking International Markets Resolution W&G (1) & other (2) Total RBS £m £m £m £m £m £m £m £m £m £m Income statement Net interest income 1 032 95 482 110 76 14 157 163 74 2 203 Other non-interest income 282 43 307 55 17 470 250 41 (134) 1 331 Total income - adjusted (3) 1 314 138 789 165 93 484 407 204 (60) 3 534 Own credit adjustments -- -- -- -- -- 46 65 -- 9 120 Strategic disposals -- -- -- -- -- -- (14) -- (121) (135) Total income 1 314 138 789 165 93 530 458 204 (172) 3 519 Direct expenses - staff costs (200) (40) (123) (46) (10) (109) (92) (45) (620) (1 285) - other costs (64) (18) (51) (9) (4) (26) (57) (6) (788) (1 023) Indirect expenses (445) (43) (241) (68) (24) (257) (260) (25) 1 363 -- Operating expenses - adjusted (4) (709) (101) (415) (123) (38) (392) (409) (76) (45) (2 308) Restructuring costs - direct -- -- -- -- -- -- (16) -- (431) (447) - indirect (30) 1 1 3 (2) (91) (184) -- 302 -- Litigation and conduct costs (354) -- -- (2) -- (334) (166) -- -- (856) Operating expenses (1 093) (100) (414) (122) (40) (817) (775) (76) (174) (3 611) Operating profit/(loss) before impairment (losses)/releases 221 38 375 43 53 (287) (317) 128 (346) (92) Impairment (losses)/releases (20) 25 1 1 (2) 8 145 21 (50) 129 Operating profit/(loss) 201 63 376 44 51 (279) (172) 149 (396) 37 Operating profit/(loss) - adjusted (3,4) 585 62 375 43 53 100 143 149 (155) 1 355 Additional information Return on equity (5) 8,4% 10,1% 12,4% 7,8% 18,8% (13,3%) nm nm nm (4,3%) Return on equity - adjusted (3,4,5) 27,2% 9,9% 12,4% 7,5% 19,5% 3,0% nm nm nm 7,4% Cost:income ratio 83% 72% 52% 74% 43% 154% nm 37% nm 103% Cost:income ratio - adjusted (3,4) 54% 73% 53% 75% 41% 81% nm 37% nm 65% Total assets (£bn) 137,8 21,7 131,1 17,3 24,3 308,7 338,7 23,7 101,6 1 104,9 Funded assets (£bn) (6) 137,8 21,6 131,1 17,3 24,3 152,1 108,3 23,7 97,7 713,9 Net loans and advances to customers (£bn) 111,7 16,7 86,2 11,1 7,2 31,6 48,5 19,5 67,7 400,2 Risk elements in lending (£bn) 3,4 4,0 2,3 0,1 0,1 -- 10,4 0,6 1,4 22,3 Impairment provisions (£bn) (2,4) (2,1) (0,8) (0,1) (0,1) -- (7,3) (0,4) (0,6) (13,8) Customer deposits (£bn) 131,6 13,5 90,0 22,0 22,7 11,2 34,6 22,1 74,9 422,6 Risk-weighted assets (RWAs) (£bn) 35,9 20,4 63,1 8,4 7,9 43,8 84,3 10,5 74,3 348,6 RWA equivalent (£bn) (5) 38,6 19,3 69,7 8,4 7,9 44,5 90,1 11,1 74,7 364,3 Employee numbers (FTEs - thousands) 22,7 2,4 5,8 2,0 0,6 1,6 2,3 4,4 49,9 91,7 nm = not meaningful. For the notes to this table refer to page 23. RBS Group - Q4 2016 Financial Supplement Page 21
 Financial Supplement Page 20 Page 22