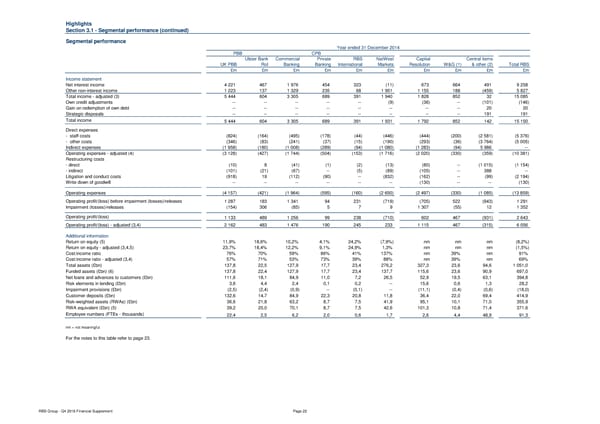
Highlights Section 3.1 - Segmental performance (continued) Segmental performance Year ended 31 December 2014 PBB CPB Ulster Bank Commercial Private RBS NatWest Capital Central items UK PBB RoI Banking Banking International Markets Resolution W&G (1) & other (2) Total RBS £m £m £m £m £m £m £m £m £m £m Income statement Net interest income 4 221 467 1 976 454 323 (11) 673 664 491 9 258 Other non-interest income 1 223 137 1 329 235 68 1 951 1 155 188 (459) 5 827 Total income - adjusted (3) 5 444 604 3 305 689 391 1 940 1 828 852 32 15 085 Own credit adjustments -- -- -- -- -- (9) (36) -- (101) (146) Gain on redemption of own debt -- -- -- -- -- -- -- -- 20 20 Strategic disposals -- -- -- -- -- -- -- -- 191 191 Total income 5 444 604 3 305 689 391 1 931 1 792 852 142 15 150 Direct expenses - staff costs (824) (164) (495) (178) (44) (446) (444) (200) (2 581) (5 376) - other costs (346) (83) (241) (37) (15) (190) (293) (36) (3 764) (5 005) Indirect expenses (1 958) (180) (1 008) (289) (94) (1 080) (1 283) (94) 5 986 -- Operating expenses - adjusted (4) (3 128) (427) (1 744) (504) (153) (1 716) (2 020) (330) (359) (10 381) Restructuring costs - direct (10) 8 (41) (1) (2) (13) (80) -- (1 015) (1 154) - indirect (101) (21) (67) -- (5) (89) (105) -- 388 -- Litigation and conduct costs (918) 19 (112) (90) -- (832) (162) -- (99) (2 194) Write down of goodwill -- -- -- -- -- -- (130) -- -- (130) Operating expenses (4 157) (421) (1 964) (595) (160) (2 650) (2 497) (330) (1 085) (13 859) Operating profit/(loss) before impairment (losses)/releases 1 287 183 1 341 94 231 (719) (705) 522 (943) 1 291 Impairment (losses)/releases (154) 306 (85) 5 7 9 1 307 (55) 12 1 352 Operating profit/(loss) 1 133 489 1 256 99 238 (710) 602 467 (931) 2 643 Operating profit/(loss) - adjusted (3,4) 2 162 483 1 476 190 245 233 1 115 467 (315) 6 056 Additional information Return on equity (5) 11,9% 18,6% 10,2% 4,1% 24,2% (7,9%) nm nm nm (8,2%) Return on equity - adjusted (3,4,5) 23,7% 18,4% 12,2% 9,1% 24,9% 1,3% nm nm nm (1,5%) Cost:income ratio 76% 70% 59% 86% 41% 137% nm 39% nm 91% Cost:income ratio - adjusted (3,4) 57% 71% 53% 73% 39% 88% nm 39% nm 69% Total assets (£bn) 137,8 22,5 127,9 17,7 23,4 276,2 327,3 23,6 94,6 1 051,0 Funded assets (£bn) (6) 137,8 22,4 127,9 17,7 23,4 137,7 115,6 23,6 90,9 697,0 Net loans and advances to customers (£bn) 111,6 18,1 84,9 11,0 7,2 26,5 52,9 19,5 63,1 394,8 Risk elements in lending (£bn) 3,6 4,4 2,4 0,1 0,2 -- 15,6 0,6 1,3 28,2 Impairment provisions (£bn) (2,5) (2,4) (0,9) -- (0,1) -- (11,1) (0,4) (0,6) (18,0) Customer deposits (£bn) 132,6 14,7 84,9 22,3 20,8 11,8 36,4 22,0 69,4 414,9 Risk-weighted assets (RWAs) (£bn) 36,6 21,8 63,2 8,7 7,5 41,9 95,1 10,1 71,0 355,9 RWA equivalent (£bn) (5) 39,2 20,0 70,1 8,7 7,5 42,6 101,3 10,8 71,4 371,6 Employee numbers (FTEs - thousands) 22,4 2,5 6,2 2,0 0,6 1,7 2,6 4,4 48,9 91,3 nm = not meaningful. For the notes to this table refer to page 23. RBS Group - Q4 2016 Financial Supplement Page 22
 Financial Supplement Page 21 Page 23