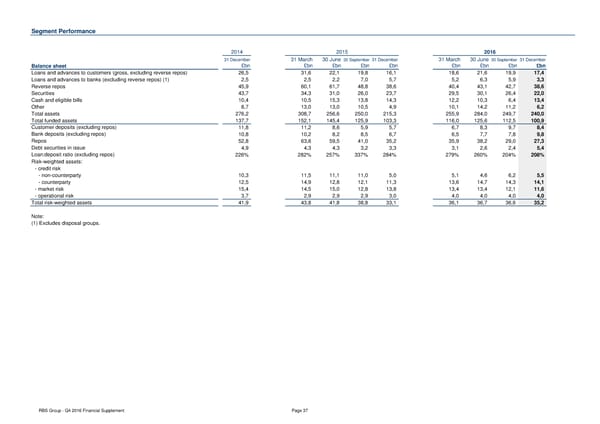
Segment Performance 2014 2015 2016 31 December 31 March 30 June 30 September 31 December 31 March 30 June 30 September 31 December Balance sheet £bn £bn £bn £bn £bn £bn £bn £bn £bn Loans and advances to customers (gross, excluding reverse repos) 26,5 31,6 22,1 19,8 16,1 18,6 21,6 19,9 17,4 Loans and advances to banks (excluding reverse repos) (1) 2,5 2,5 2,2 7,0 5,7 5,2 6,3 5,9 3,3 Reverse repos 45,9 60,1 61,7 48,8 38,6 40,4 43,1 42,7 38,6 Securities 43,7 34,3 31,0 26,0 23,7 29,5 30,1 26,4 22,0 Cash and eligible bills 10,4 10,5 15,3 13,8 14,3 12,2 10,3 6,4 13,4 Other 8,7 13,0 13,0 10,5 4,9 10,1 14,2 11,2 6,2 Total assets 276,2 308,7 256,6 250,0 215,3 255,9 284,0 249,7 240,0 Total funded assets 137,7 152,1 145,4 125,9 103,3 116,0 125,6 112,5 100,9 Customer deposits (excluding repos) 11,8 11,2 8,6 5,9 5,7 6,7 8,3 9,7 8,4 Bank deposits (excluding repos) 10,8 10,2 8,2 8,5 6,7 6,5 7,7 7,8 9,8 Repos 52,8 63,6 59,5 41,0 35,2 35,9 38,2 29,0 27,3 Debt securities in issue 4,9 4,3 4,3 3,2 3,3 3,1 2,6 2,4 5,4 Loan:deposit ratio (excluding repos) 226% 282% 257% 337% 284% 279% 260% 204% 208% Risk-weighted assets: - credit risk - non-counterparty 10,3 11,5 11,1 11,0 5,0 5,1 4,6 6,2 5,5 - counterparty 12,5 14,9 12,8 12,1 11,3 13,6 14,7 14,3 14,1 - market risk 15,4 14,5 15,0 12,8 13,8 13,4 13,4 12,1 11,6 - operational risk 3,7 2,9 2,9 2,9 3,0 4,0 4,0 4,0 4,0 Total risk-weighted assets 41,9 43,8 41,8 38,8 33,1 36,1 36,7 36,6 35,2 Note: (1) Excludes disposal groups. RBS Group - Q4 2016 Financial Supplement Page 37
 Financial Supplement Page 36 Page 38