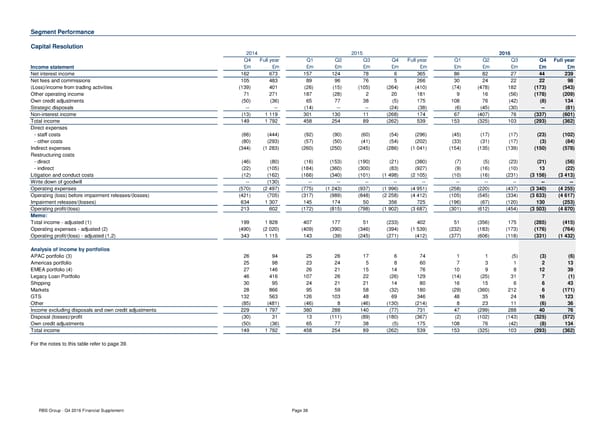
Segment Performance Capital Resolution 2014 2015 2016 Q4 Full year Q1 Q2 Q3 Q4 Full year Q1 Q2 Q3 Q4 Full year Income statement £m £m £m £m £m £m £m £m £m £m £m £m Net interest income 162 673 157 124 78 6 365 86 82 27 44 239 Net fees and commissions 105 483 89 96 76 5 266 30 24 22 22 98 (Loss)/income from trading activities (139) 401 (26) (15) (105) (264) (410) (74) (478) 182 (173) (543) Other operating income 71 271 187 (28) 2 20 181 9 16 (56) (178) (209) Own credit adjustments (50) (36) 65 77 38 (5) 175 108 76 (42) (8) 134 Strategic disposals -- -- (14) -- -- (24) (38) (6) (45) (30) -- (81) Non-interest income (13) 1 119 301 130 11 (268) 174 67 (407) 76 (337) (601) Total income 149 1 792 458 254 89 (262) 539 153 (325) 103 (293) (362) Direct expenses - staff costs (66) (444) (92) (90) (60) (54) (296) (45) (17) (17) (23) (102) - other costs (80) (293) (57) (50) (41) (54) (202) (33) (31) (17) (3) (84) Indirect expenses (344) (1 283) (260) (250) (245) (286) (1 041) (154) (135) (139) (150) (578) Restructuring costs - direct (46) (80) (16) (153) (190) (21) (380) (7) (5) (23) (21) (56) - indirect (22) (105) (184) (360) (300) (83) (927) (9) (16) (10) 13 (22) Litigation and conduct costs (12) (162) (166) (340) (101) (1 498) (2 105) (10) (16) (231) (3 156) (3 413) Write down of goodwill -- (130) -- -- -- -- -- -- -- -- -- -- Operating expenses (570) (2 497) (775) (1 243) (937) (1 996) (4 951) (258) (220) (437) (3 340) (4 255) Operating (loss) before impairment releases/(losses) (421) (705) (317) (989) (848) (2 258) (4 412) (105) (545) (334) (3 633) (4 617) Impairment releases/(losses) 634 1 307 145 174 50 356 725 (196) (67) (120) 130 (253) Operating profit/(loss) 213 602 (172) (815) (798) (1 902) (3 687) (301) (612) (454) (3 503) (4 870) Memo: Total income - adjusted (1) 199 1 828 407 177 51 (233) 402 51 (356) 175 (285) (415) Operating expenses - adjusted (2) (490) (2 020) (409) (390) (346) (394) (1 539) (232) (183) (173) (176) (764) Operating profit/(loss) - adjusted (1,2) 343 1 115 143 (39) (245) (271) (412) (377) (606) (118) (331) (1 432) Analysis of income by portfolios APAC portfolio (3) 26 94 25 26 17 6 74 1 1 (5) (3) (6) Americas portfolio 25 98 23 24 5 8 60 7 3 1 2 13 EMEA portfolio (4) 27 146 26 21 15 14 76 10 9 8 12 39 Legacy Loan Portfolio 46 416 107 26 22 (26) 129 (14) (25) 31 7 (1) Shipping 30 95 24 21 21 14 80 16 15 6 6 43 Markets 28 866 95 59 58 (32) 180 (29) (360) 212 6 (171) GTS 132 563 126 103 48 69 346 48 35 24 16 123 Other (85) (481) (46) 8 (46) (130) (214) 8 23 11 (6) 36 Income excluding disposals and own credit adjustments 229 1 797 380 288 140 (77) 731 47 (299) 288 40 76 Disposal (losses)/profit (30) 31 13 (111) (89) (180) (367) (2) (102) (143) (325) (572) Own credit adjustments (50) (36) 65 77 38 (5) 175 108 76 (42) (8) 134 Total income 149 1 792 458 254 89 (262) 539 153 (325) 103 (293) (362) For the notes to this table refer to page 39. RBS Group - Q4 2016 Financial Supplement Page 38
 Financial Supplement Page 37 Page 39