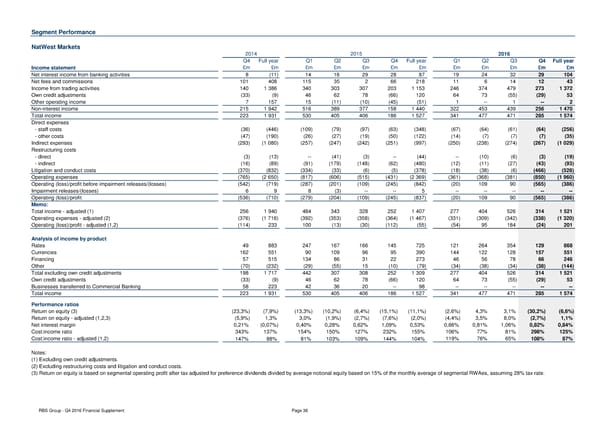
Segment Performance NatWest Markets 2014 2015 2016 Q4 Full year Q1 Q2 Q3 Q4 Full year Q1 Q2 Q3 Q4 Full year Income statement £m £m £m £m £m £m £m £m £m £m £m £m Net interest income from banking activities 8 (11) 14 16 29 28 87 19 24 32 29 104 Net fees and commissions 101 408 115 35 2 66 218 11 6 14 12 43 Income from trading activities 140 1 386 340 303 307 203 1 153 246 374 479 273 1 372 Own credit adjustments (33) (9) 46 62 78 (66) 120 64 73 (55) (29) 53 Other operating income 7 157 15 (11) (10) (45) (51) 1 -- 1 -- 2 Non-interest income 215 1 942 516 389 377 158 1 440 322 453 439 256 1 470 Total income 223 1 931 530 405 406 186 1 527 341 477 471 285 1 574 Direct expenses - staff costs (36) (446) (109) (79) (97) (63) (348) (67) (64) (61) (64) (256) - other costs (47) (190) (26) (27) (19) (50) (122) (14) (7) (7) (7) (35) Indirect expenses (293) (1 080) (257) (247) (242) (251) (997) (250) (238) (274) (267) (1 029) Restructuring costs - direct (3) (13) -- (41) (3) -- (44) -- (10) (6) (3) (19) - indirect (16) (89) (91) (179) (148) (62) (480) (12) (11) (27) (43) (93) Litigation and conduct costs (370) (832) (334) (33) (6) (5) (378) (18) (38) (6) (466) (528) Operating expenses (765) (2 650) (817) (606) (515) (431) (2 369) (361) (368) (381) (850) (1 960) Operating (loss)/profit before impairment releases/(losses) (542) (719) (287) (201) (109) (245) (842) (20) 109 90 (565) (386) Impairment releases/(losses) 6 9 8 (3) -- -- 5 -- -- -- -- -- Operating (loss)/profit (536) (710) (279) (204) (109) (245) (837) (20) 109 90 (565) (386) Memo: Total income - adjusted (1) 256 1 940 484 343 328 252 1 407 277 404 526 314 1 521 Operating expenses - adjusted (2) (376) (1 716) (392) (353) (358) (364) (1 467) (331) (309) (342) (338) (1 320) Operating (loss)/profit - adjusted (1,2) (114) 233 100 (13) (30) (112) (55) (54) 95 184 (24) 201 Analysis of income by product Rates 49 883 247 167 166 145 725 121 264 354 129 868 Currencies 162 551 90 109 96 95 390 144 122 128 157 551 Financing 57 515 134 86 31 22 273 46 56 78 66 246 Other (70) (232) (29) (55) 15 (10) (79) (34) (38) (34) (38) (144) Total excluding own credit adjustments 198 1 717 442 307 308 252 1 309 277 404 526 314 1 521 Own credit adjustments (33) (9) 46 62 78 (66) 120 64 73 (55) (29) 53 Businesses transferred to Commercial Banking 58 223 42 36 20 -- 98 -- -- -- -- -- Total income 223 1 931 530 405 406 186 1 527 341 477 471 285 1 574 Performance ratios Return on equity (3) (23,3%) (7,9%) (13,3%) (10,2%) (6,4%) (15,1%) (11,1%) (2,6%) 4,3% 3,1% (30,2%) (6,6%) Return on equity - adjusted (1,2,3) (5,9%) 1,3% 3,0% (1,9%) (2,7%) (7,6%) (2,0%) (4,4%) 3,5% 8,0% (2,7%) 1,1% Net interest margin 0,21% (0,07%) 0,40% 0,28% 0,62% 1,09% 0,53% 0,66% 0,81% 1,06% 0,82% 0,84% Cost:income ratio 343% 137% 154% 150% 127% 232% 155% 106% 77% 81% 298% 125% Cost:income ratio - adjusted (1,2) 147% 88% 81% 103% 109% 144% 104% 119% 76% 65% 108% 87% Notes: (1) Excluding own credit adjustments. (2) Excluding restructuring costs and litigation and conduct costs. (3) Return on equity is based on segmental operating profit after tax adjusted for preference dividends divided by average notional equity based on 15% of the monthly average of segmental RWAes, assuming 28% tax rate. RBS Group - Q4 2016 Financial Supplement Page 36
 Financial Supplement Page 35 Page 37