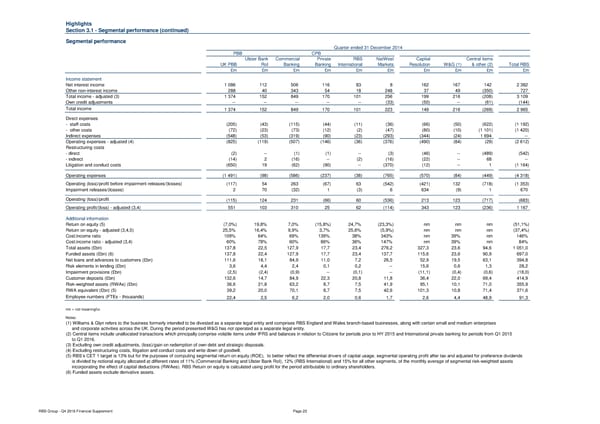
Highlights Section 3.1 - Segmental performance (continued) Segmental performance Quarter ended 31 December 2014 PBB CPB Ulster Bank Commercial Private RBS NatWest Capital Central items UK PBB RoI Banking Banking International Markets Resolution W&G (1) & other (2) Total RBS £m £m £m £m £m £m £m £m £m £m Income statement Net interest income 1 086 112 506 116 83 8 162 167 142 2 382 Other non-interest income 288 40 343 54 18 248 37 49 (350) 727 Total income - adjusted (3) 1 374 152 849 170 101 256 199 216 (208) 3 109 Own credit adjustments -- -- -- -- -- (33) (50) -- (61) (144) Total income 1 374 152 849 170 101 223 149 216 (269) 2 965 Direct expenses - staff costs (205) (43) (115) (44) (11) (36) (66) (50) (622) (1 192) - other costs (72) (23) (73) (12) (2) (47) (80) (10) (1 101) (1 420) Indirect expenses (548) (53) (319) (90) (23) (293) (344) (24) 1 694 -- Operating expenses - adjusted (4) (825) (119) (507) (146) (36) (376) (490) (84) (29) (2 612) Restructuring costs - direct (2) -- (1) (1) -- (3) (46) -- (489) (542) - indirect (14) 2 (16) -- (2) (16) (22) -- 68 -- Litigation and conduct costs (650) 19 (62) (90) -- (370) (12) -- 1 (1 164) Operating expenses (1 491) (98) (586) (237) (38) (765) (570) (84) (449) (4 318) Operating (loss)/profit before impairment releases/(losses) (117) 54 263 (67) 63 (542) (421) 132 (718) (1 353) Impairment releases/(losses) 2 70 (32) 1 (3) 6 634 (9) 1 670 Operating (loss)/profit (115) 124 231 (66) 60 (536) 213 123 (717) (683) Operating profit/(loss) - adjusted (3,4) 551 103 310 25 62 (114) 343 123 (236) 1 167 Additional information Return on equity (5) (7,0%) 19,8% 7,0% (15,8%) 24,7% (23,3%) nm nm nm (51,1%) Return on equity - adjusted (3,4,5) 25,5% 16,4% 9,9% 3,7% 25,6% (5,9%) nm nm nm (37,4%) Cost:income ratio 109% 64% 69% 139% 38% 343% nm 39% nm 146% Cost:income ratio - adjusted (3,4) 60% 78% 60% 86% 36% 147% nm 39% nm 84% Total assets (£bn) 137,8 22,5 127,9 17,7 23,4 276,2 327,3 23,6 94,6 1 051,0 Funded assets (£bn) (6) 137,8 22,4 127,9 17,7 23,4 137,7 115,6 23,6 90,9 697,0 Net loans and advances to customers (£bn) 111,6 18,1 84,9 11,0 7,2 26,5 52,9 19,5 63,1 394,8 Risk elements in lending (£bn) 3,6 4,4 2,4 0,1 0,2 -- 15,6 0,6 1,3 28,2 Impairment provisions (£bn) (2,5) (2,4) (0,9) -- (0,1) -- (11,1) (0,4) (0,6) (18,0) Customer deposits (£bn) 132,6 14,7 84,9 22,3 20,8 11,8 36,4 22,0 69,4 414,9 Risk-weighted assets (RWAs) (£bn) 36,6 21,8 63,2 8,7 7,5 41,9 95,1 10,1 71,0 355,9 RWA equivalent (£bn) (5) 39,2 20,0 70,1 8,7 7,5 42,6 101,3 10,8 71,4 371,6 Employee numbers (FTEs - thousands) 22,4 2,5 6,2 2,0 0,6 1,7 2,6 4,4 48,9 91,3 nm = not meaningful. Notes: (1) Williams & Glyn refers to the business formerly intended to be divested as a separate legal entity and comprises RBS England and Wales branch-based businesses, along with certain small and medium enterprises and corporate activities across the UK. During the period presented W&G has not operated as a separate legal entity. (2) Central items include unallocated transactions which principally comprise volatile items under IFRS and balances in relation to Citizens for periods prior to HY 2015 and International private banking for periods from Q1 2015 to Q1 2016. (3) Excluding own credit adjustments, (loss)/gain on redemption of own debt and strategic disposals. (4) Excluding restructuring costs, litigation and conduct costs and write down of goodwill. (5) RBS’s CET 1 target is 13% but for the purposes of computing segmental return on equity (ROE), to better reflect the differential drivers of capital usage, segmental operating profit after tax and adjusted for preference dividends is divided by notional equity allocated at different rates of 11% (Commercial Banking and Ulster Bank RoI), 12% (RBS International) and 15% for all other segments, of the monthly average of segmental risk-weighted assets incorporating the effect of capital deductions (RWAes). RBS Return on equity is calculated using profit for the period attributable to ordinary shareholders. (6) Funded assets exclude derivative assets. RBS Group - Q4 2016 Financial Supplement Page 23
 Financial Supplement Page 22 Page 24