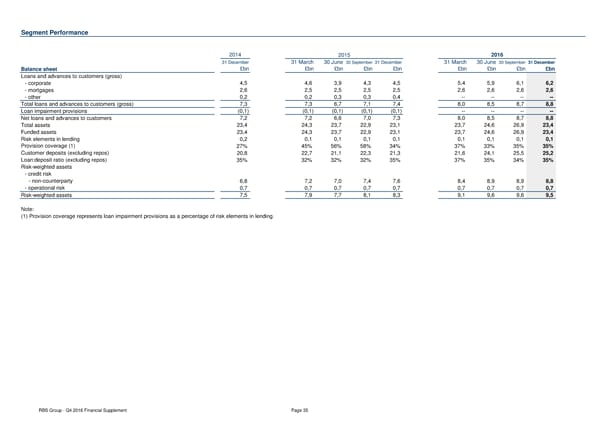
Segment Performance 2014 2015 2016 31 December 31 March 30 June 30 September 31 December 31 March 30 June 30 September 31 December Balance sheet £bn £bn £bn £bn £bn £bn £bn £bn £bn Loans and advances to customers (gross) - corporate 4,5 4,6 3,9 4,3 4,5 5,4 5,9 6,1 6,2 - mortgages 2,6 2,5 2,5 2,5 2,5 2,6 2,6 2,6 2,6 - other 0,2 0,2 0,3 0,3 0,4 -- -- -- -- Total loans and advances to customers (gross) 7,3 7,3 6,7 7,1 7,4 8,0 8,5 8,7 8,8 Loan impairment provisions (0,1) (0,1) (0,1) (0,1) (0,1) -- -- -- -- Net loans and advances to customers 7,2 7,2 6,6 7,0 7,3 8,0 8,5 8,7 8,8 Total assets 23,4 24,3 23,7 22,9 23,1 23,7 24,6 26,9 23,4 Funded assets 23,4 24,3 23,7 22,9 23,1 23,7 24,6 26,9 23,4 Risk elements in lending 0,2 0,1 0,1 0,1 0,1 0,1 0,1 0,1 0,1 Provision coverage (1) 27% 45% 56% 58% 34% 37% 33% 35% 35% Customer deposits (excluding repos) 20,8 22,7 21,1 22,3 21,3 21,6 24,1 25,5 25,2 Loan:deposit ratio (excluding repos) 35% 32% 32% 32% 35% 37% 35% 34% 35% Risk-weighted assets - credit risk - non-counterparty 6,8 7,2 7,0 7,4 7,6 8,4 8,9 8,9 8,8 - operational risk 0,7 0,7 0,7 0,7 0,7 0,7 0,7 0,7 0,7 Risk-weighted assets 7,5 7,9 7,7 8,1 8,3 9,1 9,6 9,6 9,5 Note: (1) Provision coverage represents loan impairment provisions as a percentage of risk elements in lending. RBS Group - Q4 2016 Financial Supplement Page 35
 Financial Supplement Page 34 Page 36