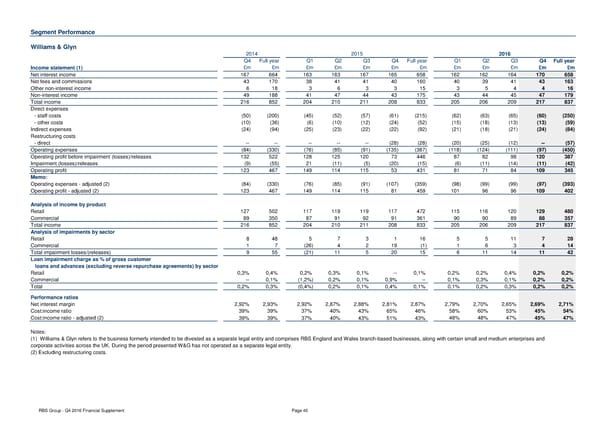
Segment Performance Williams & Glyn 2014 2015 2016 Q4 Full year Q1 Q2 Q3 Q4 Full year Q1 Q2 Q3 Q4 Full year Income statement (1) £m £m £m £m £m £m £m £m £m £m £m £m Net interest income 167 664 163 163 167 165 658 162 162 164 170 658 Net fees and commissions 43 170 38 41 41 40 160 40 39 41 43 163 Other non-interest income 6 18 3 6 3 3 15 3 5 4 4 16 Non-interest income 49 188 41 47 44 43 175 43 44 45 47 179 Total income 216 852 204 210 211 208 833 205 206 209 217 837 Direct expenses - staff costs (50) (200) (45) (52) (57) (61) (215) (62) (63) (65) (60) (250) - other costs (10) (36) (6) (10) (12) (24) (52) (15) (18) (13) (13) (59) Indirect expenses (24) (94) (25) (23) (22) (22) (92) (21) (18) (21) (24) (84) Restructuring costs - direct -- -- -- -- -- (28) (28) (20) (25) (12) -- (57) Operating expenses (84) (330) (76) (85) (91) (135) (387) (118) (124) (111) (97) (450) Operating profit before impairment (losses)/releases 132 522 128 125 120 73 446 87 82 98 120 387 Impairment (losses)/releases (9) (55) 21 (11) (5) (20) (15) (6) (11) (14) (11) (42) Operating profit 123 467 149 114 115 53 431 81 71 84 109 345 Memo: Operating expenses - adjusted (2) (84) (330) (76) (85) (91) (107) (359) (98) (99) (99) (97) (393) Operating profit - adjusted (2) 123 467 149 114 115 81 459 101 96 96 109 402 Analysis of income by product Retail 127 502 117 119 119 117 472 115 116 120 129 480 Commercial 89 350 87 91 92 91 361 90 90 89 88 357 Total income 216 852 204 210 211 208 833 205 206 209 217 837 Analysis of impairments by sector Retail 8 48 5 7 3 1 16 5 5 11 7 28 Commercial 1 7 (26) 4 2 19 (1) 1 6 3 4 14 Total impairment losses/(releases) 9 55 (21) 11 5 20 15 6 11 14 11 42 Loan impairment charge as % of gross customer loans and advances (excluding reverse repurchase agreements) by sector Retail 0,3% 0,4% 0,2% 0,3% 0,1% -- 0,1% 0,2% 0,2% 0,4% 0,2% 0,2% Commercial -- 0,1% (1,2%) 0,2% 0,1% 0,9% -- 0,1% 0,3% 0,1% 0,2% 0,2% Total 0,2% 0,3% (0,4%) 0,2% 0,1% 0,4% 0,1% 0,1% 0,2% 0,3% 0,2% 0,2% Performance ratios Net interest margin 2,92% 2,93% 2,92% 2,87% 2,88% 2,81% 2,87% 2,79% 2,70% 2,65% 2,69% 2,71% Cost:income ratio 39% 39% 37% 40% 43% 65% 46% 58% 60% 53% 45% 54% Cost:income ratio - adjusted (2) 39% 39% 37% 40% 43% 51% 43% 48% 48% 47% 45% 47% Notes: (1) Williams & Glyn refers to the business formerly intended to be divested as a separate legal entity and comprises RBS England and Wales branch-based businesses, along with certain small and medium enterprises and corporate activities across the UK. During the period presented W&G has not operated as a separate legal entity. (2) Excluding restructuring costs. RBS Group - Q4 2016 Financial Supplement Page 40
 Financial Supplement Page 39 Page 41