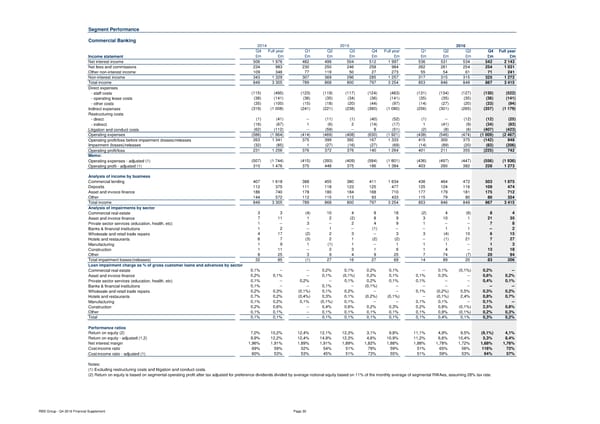
Segment Performance Commercial Banking 2014 2015 2016 Q4 Full year Q1 Q2 Q3 Q4 Full year Q1 Q2 Q3 Q4 Full year Income statement £m £m £m £m £m £m £m £m £m £m £m £m Net interest income 506 1 976 482 499 504 512 1 997 536 531 534 542 2 143 Net fees and commissions 234 983 230 250 246 258 984 262 261 254 254 1 031 Other non-interest income 109 346 77 119 50 27 273 55 54 61 71 241 Non-interest income 343 1 329 307 369 296 285 1 257 317 315 315 325 1 272 Total income 849 3 305 789 868 800 797 3 254 853 846 849 867 3 415 Direct expenses - staff costs (115) (495) (123) (119) (117) (124) (483) (131) (134) (127) (130) (522) - operating lease costs (38) (141) (36) (35) (34) (36) (141) (35) (35) (35) (36) (141) - other costs (35) (100) (15) (18) (20) (44) (97) (14) (27) (20) (33) (94) Indirect expenses (319) (1 008) (241) (221) (238) (380) (1 080) (256) (301) (265) (357) (1 179) Restructuring costs - direct (1) (41) -- (11) (1) (40) (52) (1) -- (12) (12) (25) - indirect (16) (67) 1 (6) 2 (14) (17) 1 (41) (9) (34) (83) Litigation and conduct costs (62) (112) -- (59) -- 8 (51) (2) (8) (6) (407) (423) Operating expenses (586) (1 964) (414) (469) (408) (630) (1 921) (438) (546) (474) (1 009) (2 467) Operating profit/loss before impairment (losses)/releases 263 1 341 375 399 392 167 1 333 415 300 375 (142) 948 Impairment (losses)/releases (32) (85) 1 (27) (16) (27) (69) (14) (89) (20) (83) (206) Operating profit/loss 231 1 256 376 372 376 140 1 264 401 211 355 (225) 742 Memo: Operating expenses - adjusted (1) (507) (1 744) (415) (393) (409) (584) (1 801) (436) (497) (447) (556) (1 936) Operating profit - adjusted (1) 310 1 476 375 448 375 186 1 384 403 260 382 228 1 273 Analysis of income by business Commercial lending 407 1 618 388 455 380 411 1 634 436 464 472 503 1 875 Deposits 112 375 111 118 123 125 477 125 124 116 109 474 Asset and invoice finance 186 740 178 180 184 168 710 177 179 181 175 712 Other 144 572 112 115 113 93 433 115 79 80 80 354 Total income 849 3 305 789 868 800 797 3 254 853 846 849 867 3 415 Analysis of impairments by sector Commercial real estate 3 3 (4) 10 4 8 18 (2) 4 (6) 8 4 Asset and invoice finance 7 11 1 2 (2) 8 9 3 10 1 21 35 Private sector services (education, health, etc) 1 -- 3 -- 2 4 9 1 -- -- 7 8 Banks & financial institutions 1 2 -- 1 -- (1) -- -- 1 1 -- 2 Wholesale and retail trade repairs 4 17 (2) 2 3 -- 3 3 (4) 10 6 15 Hotels and restaurants 6 7 (3) 2 1 (2) (2) -- (1) 21 7 27 Manufacturing 1 9 1 (1) 1 -- 1 1 1 -- 1 3 Construction 1 11 -- 2 3 1 6 1 4 -- 13 18 Other 8 25 3 9 4 9 25 7 74 (7) 20 94 Total impairment losses/(releases) 32 85 (1) 27 16 27 69 14 89 20 83 206 Loan impairment charge as % of gross customer loans and advances by sector Commercial real estate 0,1% -- -- 0,2% 0,1% 0,2% 0,1% -- 0,1% (0,1%) 0,2% -- Asset and invoice finance 0,2% 0,1% -- 0,1% (0,1%) 0,2% 0,1% 0,1% 0,3% -- 0,6% 0,2% Private sector services (education, health, etc) 0,1% -- 0,2% -- 0,1% 0,2% 0,1% 0,1% -- -- 0,4% 0,1% Banks & financial institutions 0,1% -- -- 0,1% -- (0,1%) -- -- -- -- -- -- Wholesale and retail trade repairs 0,2% 0,3% (0,1%) 0,1% 0,2% -- -- 0,1% (0,2%) 0,5% 0,3% 0,2% Hotels and restaurants 0,7% 0,2% (0,4%) 0,3% 0,1% (0,2%) (0,1%) -- (0,1%) 2,4% 0,8% 0,7% Manufacturing 0,1% 0,2% 0,1% (0,1%) 0,1% -- -- 0,1% 0,1% -- 0,1% -- Construction 0,2% 0,6% -- 0,4% 0,6% 0,2% 0,3% 0,2% 0,8% (0,1%) 2,5% 0,8% Other 0,1% 0,1% -- 0,1% 0,1% 0,1% 0,1% 0,1% 0,9% (0,1%) 0,2% 0,3% Total 0,1% 0,1% -- 0,1% 0,1% 0,1% 0,1% 0,1% 0,4% 0,1% 0,3% 0,2% Performance ratios Return on equity (2) 7,0% 10,2% 12,4% 12,1% 12,3% 3,1% 9,8% 11,1% 4,9% 9,5% (9,1%) 4,1% Return on equity - adjusted (1,2) 9,9% 12,2% 12,4% 14,9% 12,3% 4,6% 10,9% 11,2% 6,6% 10,4% 5,3% 8,4% Net interest margin 1,96% 1,91% 1,89% 1,91% 1,89% 1,82% 1,88% 1,88% 1,78% 1,72% 1,68% 1,76% Cost:income ratio 69% 59% 52% 54% 51% 79% 59% 51% 65% 56% 116% 72% Cost:income ratio - adjusted (1) 60% 53% 53% 45% 51% 73% 55% 51% 59% 53% 64% 57% Notes: (1) Excluding restructuring costs and litigation and conduct costs. (2) Return on equity is based on segmental operating profit after tax adjusted for preference dividends divided by average notional equity based on 11% of the monthly average of segmental RWAes, assuming 28% tax rate. RBS Group - Q4 2016 Financial Supplement Page 30
 Financial Supplement Page 29 Page 31