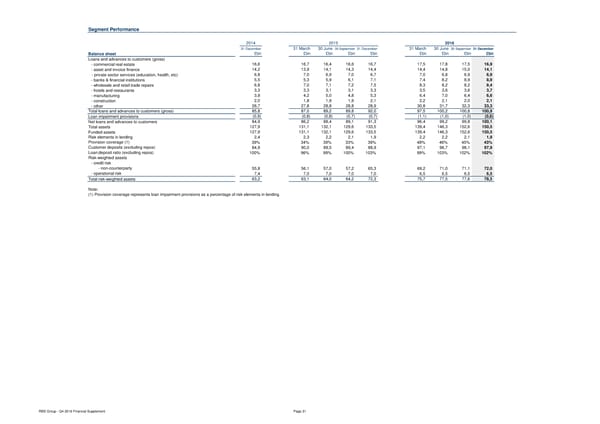
Segment Performance 2014 2015 2016 31 December 31 March 30 June 30 September 31 December 31 March 30 June 30 September 31 December Balance sheet £bn £bn £bn £bn £bn £bn £bn £bn £bn Loans and advances to customers (gross) - commercial real estate 16,6 16,7 16,4 16,6 16,7 17,5 17,8 17,5 16,9 - asset and invoice finance 14,2 13,9 14,1 14,3 14,4 14,4 14,8 15,0 14,1 - private sector services (education, health, etc) 6,8 7,0 6,9 7,0 6,7 7,0 6,8 6,9 6,9 - banks & financial institutions 5,5 5,3 5,9 6,1 7,1 7,4 8,2 8,9 8,9 - wholesale and retail trade repairs 6,8 7,0 7,1 7,2 7,5 8,3 8,2 8,2 8,4 - hotels and restaurants 3,3 3,3 3,1 3,1 3,3 3,5 3,6 3,6 3,7 - manufacturing 3,9 4,2 5,0 4,8 5,3 6,4 7,0 6,4 6,6 - construction 2,0 1,8 1,9 1,9 2,1 2,2 2,1 2,0 2,1 - other 26,7 27,8 28,8 28,8 28,9 30,8 31,7 32,3 33,3 Total loans and advances to customers (gross) 85,8 87,0 89,2 89,8 92,0 97,5 100,2 100,8 100,9 Loan impairment provisions (0,9) (0,8) (0,8) (0,7) (0,7) (1,1) (1,0) (1,0) (0,8) Net loans and advances to customers 84,9 86,2 88,4 89,1 91,3 96,4 99,2 99,8 100,1 Total assets 127,9 131,1 132,1 129,6 133,5 139,4 146,3 152,6 150,5 Funded assets 127,9 131,1 132,1 129,6 133,5 139,4 146,3 152,6 150,5 Risk elements in lending 2,4 2,3 2,2 2,1 1,9 2,2 2,2 2,1 1,9 Provision coverage (1) 39% 34% 39% 33% 39% 48% 46% 45% 43% Customer deposits (excluding repos) 84,9 90,0 89,5 89,4 88,9 97,1 96,7 98,1 97,9 Loan:deposit ratio (excluding repos) 100% 96% 99% 100% 103% 99% 103% 102% 102% Risk-weighted assets - credit risk - non-counterparty 55,8 56,1 57,0 57,2 65,3 69,2 71,0 71,1 72,0 - operational risk 7,4 7,0 7,0 7,0 7,0 6,5 6,5 6,5 6,5 Total risk-weighted assets 63,2 63,1 64,0 64,2 72,3 75,7 77,5 77,6 78,5 Note: (1) Provision coverage represents loan impairment provisions as a percentage of risk elements in lending. RBS Group - Q4 2016 Financial Supplement Page 31
 Financial Supplement Page 30 Page 32