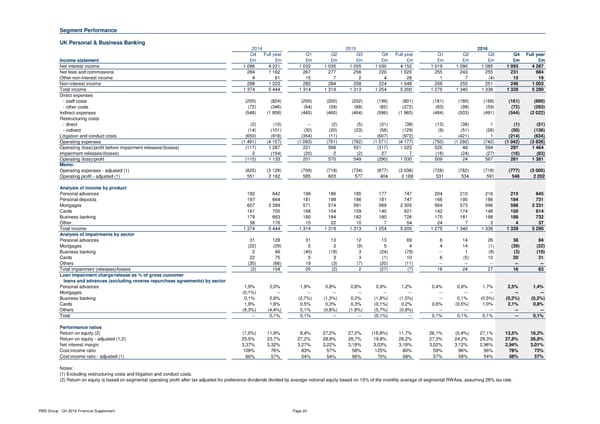
Segment Performance UK Personal & Business Banking 2014 2015 2016 Q4 Full year Q1 Q2 Q3 Q4 Full year Q1 Q2 Q3 Q4 Full year Income statement £m £m £m £m £m £m £m £m £m £m £m £m Net interest income 1 086 4 221 1 032 1 035 1 055 1 030 4 152 1 019 1 090 1 085 1 093 4 287 Net fees and commissions 284 1 162 267 277 256 220 1 020 255 243 255 231 984 Other non-interest income 4 61 15 7 2 4 28 1 7 (4) 15 19 Non-interest income 288 1 223 282 284 258 224 1 048 256 250 251 246 1 003 Total income 1 374 5 444 1 314 1 319 1 313 1 254 5 200 1 275 1 340 1 336 1 339 5 290 Direct expenses - staff costs (205) (824) (200) (200) (202) (199) (801) (181) (180) (168) (161) (690) - other costs (72) (346) (64) (58) (68) (82) (272) (63) (99) (59) (72) (293) Indirect expenses (548) (1 958) (445) (460) (464) (596) (1 965) (484) (503) (491) (544) (2 022) Restructuring costs - direct (2) (10) -- (2) (5) (31) (38) (13) (38) 1 (1) (51) - indirect (14) (101) (30) (20) (23) (56) (129) (9) (51) (26) (50) (136) Litigation and conduct costs (650) (918) (354) (11) -- (607) (972) -- (421) 1 (214) (634) Operating expenses (1 491) (4 157) (1 093) (751) (762) (1 571) (4 177) (750) (1 292) (742) (1 042) (3 826) Operating (loss)/profit before impairment releases/(losses) (117) 1 287 221 568 551 (317) 1 023 525 48 594 297 1 464 Impairment releases/(losses) 2 (154) (20) 2 (2) 27 7 (16) (24) (27) (16) (83) Operating (loss)/profit (115) 1 133 201 570 549 (290) 1 030 509 24 567 281 1 381 Memo: Operating expenses - adjusted (1) (825) (3 128) (709) (718) (734) (877) (3 038) (728) (782) (718) (777) (3 005) Operating profit - adjusted (1) 551 2 162 585 603 577 404 2 169 531 534 591 546 2 202 Analysis of income by product Personal advances 192 842 199 186 185 177 747 204 210 216 215 845 Personal deposits 197 664 181 199 186 181 747 166 195 186 184 731 Mortgages 607 2 399 571 574 591 569 2 305 564 573 596 598 2 331 Cards 161 700 168 154 159 140 621 142 174 148 150 614 Business banking 179 663 180 184 182 180 726 175 181 188 188 732 Other 38 176 15 22 10 7 54 24 7 2 4 37 Total income 1 374 5 444 1 314 1 319 1 313 1 254 5 200 1 275 1 340 1 336 1 339 5 290 Analysis of impairments by sector Personal advances 31 128 31 13 12 13 69 6 14 26 38 84 Mortgages (22) (29) 5 3 (9) 5 4 4 14 (1) (39) (22) Business banking 2 46 (40) (18) 3 (24) (79) -- 1 (8) (3) (10) Cards 22 75 5 3 3 (1) 10 6 (5) 10 20 31 Others (35) (66) 19 (3) (7) (20) (11) -- -- -- -- -- Total impairment (releases)/losses (2) 154 20 (2) 2 (27) (7) 16 24 27 16 83 Loan impairment charge/release as % of gross customer loans and advances (excluding reverse repurchase agreements) by sector Personal advances 1,9% 2,0% 1,9% 0,8% 0,8% 0,9% 1,2% 0,4% 0,9% 1,7% 2,5% 1,4% Mortgages (0,1%) -- -- -- -- -- -- -- -- -- -- -- Business banking 0,1% 0,8% (2,7%) (1,3%) 0,2% (1,8%) (1,5%) -- 0,1% (0,5%) (0,2%) (0,2%) Cards 1,9% 1,6% 0,5% 0,3% 0,3% (0,1%) 0,2% 0,6% (0,5%) 1,0% 2,1% 0,8% Others (9,3%) (4,4%) 5,1% (0,8%) (1,9%) (5,7%) (0,8%) -- -- -- -- -- Total -- 0,1% 0,1% -- -- (0,1%) -- 0,1% 0,1% 0,1% -- 0,1% Performance ratios Return on equity (2) (7,0%) 11,9% 8,4% 27,2% 27,2% (16,8%) 11,7% 26,1% (0,4%) 27,1% 13,5% 16,2% Return on equity - adjusted (1,2) 25,5% 23,7% 27,2% 28,9% 28,7% 19,8% 26,2% 27,3% 24,2% 28,3% 27,8% 26,8% Net interest margin 3,37% 3,32% 3,27% 3,22% 3,19% 3,03% 3,18% 3,02% 3,12% 2,96% 2,94% 3,01% Cost:income ratio 109% 76% 83% 57% 58% 125% 80% 59% 96% 56% 78% 72% Cost:income ratio - adjusted (1) 60% 57% 54% 54% 56% 70% 58% 57% 58% 54% 58% 57% Notes: (1) Excluding restructuring costs and litigation and conduct costs. (2) Return on equity is based on segmental operating profit after tax adjusted for preference dividends divided by average notional equity based on 15% of the monthly average of segmental RWAes, assuming 28% tax rate. RBS Group - Q4 2016 Financial Supplement Page 24
 Financial Supplement Page 23 Page 25