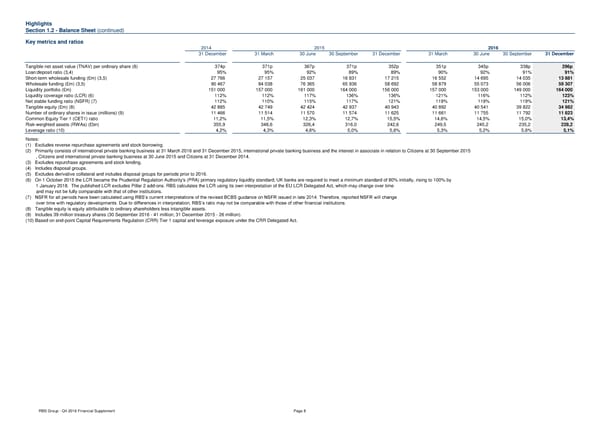
Highlights Section 1.2 - Balance Sheet (continued) Key metrics and ratios 2014 2015 2016 31 December 31 March 30 June 30 September 31 December 31 March 30 June 30 September 31 December Tangible net asset value (TNAV) per ordinary share (8) 374p 371p 367p 371p 352p 351p 345p 338p 296p Loan:deposit ratio (3,4) 95% 95% 92% 89% 89% 90% 92% 91% 91% Short-term wholesale funding (£m) (3,5) 27 766 27 157 25 037 16 831 17 215 16 552 14 695 14 035 13 881 Wholesale funding (£m) (3,5) 90 467 84 038 76 365 65 936 58 692 58 879 55 073 56 006 59 307 Liquidity portfolio (£m) 151 000 157 000 161 000 164 000 156 000 157 000 153 000 149 000 164 000 Liquidity coverage ratio (LCR) (6) 112% 112% 117% 136% 136% 121% 116% 112% 123% Net stable funding ratio (NSFR) (7) 112% 110% 115% 117% 121% 119% 119% 119% 121% Tangible equity (£m) (8) 42 885 42 749 42 424 42 937 40 943 40 892 40 541 39 822 34 982 Number of ordinary shares in issue (millions) (9) 11 466 11 514 11 570 11 574 11 625 11 661 11 755 11 792 11 823 Common Equity Tier 1 (CET1) ratio 11,2% 11,5% 12,3% 12,7% 15,5% 14,6% 14,5% 15,0% 13,4% Risk-weighted assets (RWAs) (£bn) 355,9 348,6 326,4 316,0 242,6 249,5 245,2 235,2 228,2 Leverage ratio (10) 4,2% 4,3% 4,6% 5,0% 5,6% 5,3% 5,2% 5,6% 5,1% Notes: (1) Excludes reverse repurchase agreements and stock borrowing. (2) Primarily consists of international private banking business at 31 March 2016 and 31 December 2015, international private banking business and the interest in associate in relation to Citizens at 30 September 2015 , Citizens and international private banking business at 30 June 2015 and Citizens at 31 December 2014. (3) Excludes repurchase agreements and stock lending. (4) Includes disposal groups. (5) Excludes derivative collateral and includes disposal groups for periods prior to 2016. (6) On 1 October 2015 the LCR became the Prudential Regulation Authority's (PRA) primary regulatory liquidity standard; UK banks are required to meet a minimum standard of 80% initially, rising to 100% by 1 January 2018. The published LCR excludes Pillar 2 add-ons. RBS calculates the LCR using its own interpretation of the EU LCR Delegated Act, which may change over time and may not be fully comparable with that of other institutions. (7) NSFR for all periods have been calculated using RBS’s current interpretations of the revised BCBS guidance on NSFR issued in late 2014. Therefore, reported NSFR will change over time with regulatory developments. Due to differences in interpretation, RBS’s ratio may not be comparable with those of other financial institutions. (8) Tangible equity is equity attributable to ordinary shareholders less intangible assets. (9) Includes 39 million treasury shares (30 September 2016 - 41 million; 31 December 2015 - 26 million). (10) Based on end-point Capital Requirements Regulation (CRR) Tier 1 capital and leverage exposure under the CRR Delegated Act. RBS Group - Q4 2016 Financial Supplement Page 8
 Financial Supplement Page 7 Page 9