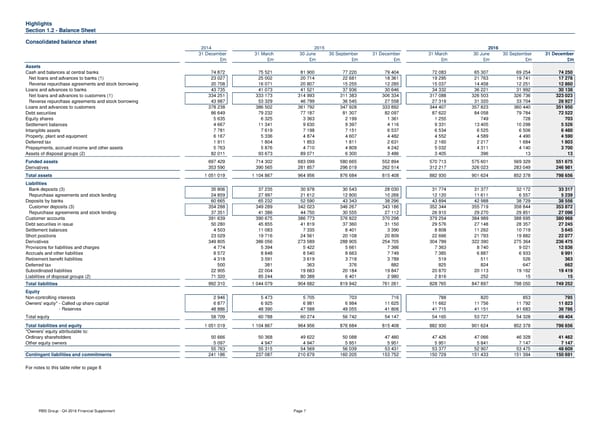
Highlights Section 1.2 - Balance Sheet Consolidated balance sheet 2014 2015 2016 31 December 31 March 30 June 30 September 31 December 31 March 30 June 30 September 31 December £m £m £m £m £m £m £m £m £m Assets Cash and balances at central banks 74 872 75 521 81 900 77 220 79 404 72 083 65 307 69 254 74 250 Net loans and advances to banks (1) 23 027 25 002 20 714 22 681 18 361 19 295 21 763 19 741 17 278 Reverse repurchase agreements and stock borrowing 20 708 16 071 20 807 15 255 12 285 15 037 14 458 12 251 12 860 Loans and advances to banks 43 735 41 073 41 521 37 936 30 646 34 332 36 221 31 992 30 138 Net loans and advances to customers (1) 334 251 333 173 314 993 311 383 306 334 317 088 326 503 326 736 323 023 Reverse repurchase agreements and stock borrowing 43 987 53 329 46 799 36 545 27 558 27 319 31 320 33 704 28 927 Loans and advances to customers 378 238 386 502 361 792 347 928 333 892 344 407 357 823 360 440 351 950 Debt securities 86 649 79 232 77 187 81 307 82 097 87 622 84 058 79 784 72 522 Equity shares 5 635 6 325 3 363 2 199 1 361 1 255 749 728 703 Settlement balances 4 667 11 341 9 630 9 397 4 116 9 331 13 405 10 298 5 526 Intangible assets 7 781 7 619 7 198 7 151 6 537 6 534 6 525 6 506 6 480 Property, plant and equipment 6 167 5 336 4 874 4 607 4 482 4 552 4 589 4 490 4 590 Deferred tax 1 911 1 804 1 853 1 811 2 631 2 160 2 217 1 684 1 803 Prepayments, accrued income and other assets 5 763 5 876 4 710 4 809 4 242 5 032 4 311 4 140 3 700 Assets of disposal groups (2) 82 011 93 673 89 071 6 300 3 486 3 405 396 13 13 Funded assets 697 429 714 302 683 099 580 665 552 894 570 713 575 601 569 329 551 675 Derivatives 353 590 390 565 281 857 296 019 262 514 312 217 326 023 283 049 246 981 Total assets 1 051 019 1 104 867 964 956 876 684 815 408 882 930 901 624 852 378 798 656 Liabilities Bank deposits (3) 35 806 37 235 30 978 30 543 28 030 31 774 31 377 32 172 33 317 Repurchase agreements and stock lending 24 859 27 997 21 612 12 800 10 266 12 120 11 611 6 557 5 239 Deposits by banks 60 665 65 232 52 590 43 343 38 296 43 894 42 988 38 729 38 556 Customer deposits (3) 354 288 349 289 342 023 346 267 343 186 352 344 355 719 358 844 353 872 Repurchase agreements and stock lending 37 351 41 386 44 750 30 555 27 112 26 910 29 270 29 851 27 096 Customer accounts 391 639 390 675 386 773 376 822 370 298 379 254 384 989 388 695 380 968 Debt securities in issue 50 280 45 855 41 819 37 360 31 150 29 576 27 148 28 357 27 245 Settlement balances 4 503 11 083 7 335 8 401 3 390 8 808 11 262 10 719 3 645 Short positions 23 029 19 716 24 561 20 108 20 809 22 666 21 793 19 882 22 077 Derivatives 349 805 386 056 273 589 288 905 254 705 304 789 322 390 275 364 236 475 Provisions for liabilities and charges 4 774 5 394 5 422 5 661 7 366 7 363 8 740 9 021 12 836 Accruals and other liabilities 8 572 8 848 8 540 8 663 7 749 7 385 6 887 6 933 6 991 Retirement benefit liabilities 4 318 3 591 3 619 3 718 3 789 519 511 526 363 Deferred tax 500 381 363 376 882 825 824 647 662 Subordinated liabilities 22 905 22 004 19 683 20 184 19 847 20 870 20 113 19 162 19 419 Liabilities of disposal groups (2) 71 320 85 244 80 388 6 401 2 980 2 816 252 15 15 Total liabilities 992 310 1 044 079 904 682 819 942 761 261 828 765 847 897 798 050 749 252 Equity Non-controlling interests 2 946 5 473 5 705 703 716 788 820 853 795 Owners' equity* - Called up share capital 6 877 6 925 6 981 6 984 11 625 11 662 11 756 11 792 11 823 Owners' equity* - Reserves 48 886 48 390 47 588 49 055 41 806 41 715 41 151 41 683 36 786 Total equity 58 709 60 788 60 274 56 742 54 147 54 165 53 727 54 328 49 404 Total liabilities and equity 1 051 019 1 104 867 964 956 876 684 815 408 882 930 901 624 852 378 798 656 *Owners' equity attributable to: Ordinary shareholders 50 666 50 368 49 622 50 088 47 480 47 426 47 066 46 328 41 462 Other equity owners 5 097 4 947 4 947 5 951 5 951 5 951 5 841 7 147 7 147 55 763 55 315 54 569 56 039 53 431 53 377 52 907 53 475 48 609 Contingent liabilities and commitments 241 186 237 087 210 679 160 205 153 752 150 729 151 433 151 394 150 691 For notes to this table refer to page 8 RBS Group - Q4 2016 Financial Supplement Page 7
 Financial Supplement Page 6 Page 8