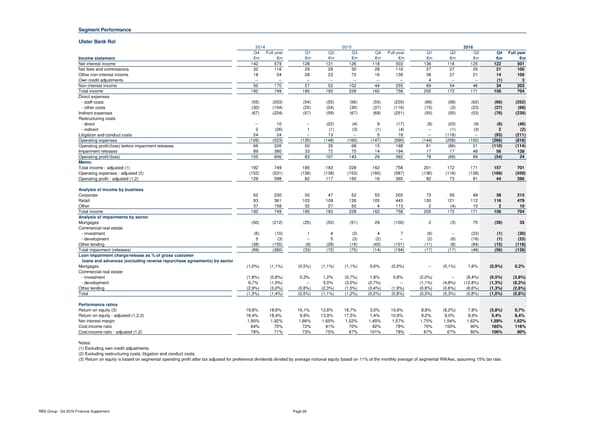
Segment Performance Ulster Bank RoI 2014 2015 2016 Q4 Full year Q1 Q2 Q3 Q4 Full year Q1 Q2 Q3 Q4 Full year Income statement €m €m €m €m €m €m €m €m €m €m €m €m Net interest income 142 579 128 131 126 118 503 136 118 125 122 501 Net fees and commissions 32 116 29 29 30 28 116 27 27 25 21 100 Other non-interest income 18 54 28 23 72 16 139 38 27 21 14 100 Own credit adjustments -- -- -- -- -- -- -- 4 -- -- (1) 3 Non-interest income 50 170 57 52 102 44 255 69 54 46 34 203 Total income 192 749 185 183 228 162 758 205 172 171 156 704 Direct expenses - staff costs (55) (203) (54) (55) (56) (55) (220) (66) (58) (62) (66) (252) - other costs (30) (104) (25) (24) (30) (37) (116) (15) (3) (23) (27) (68) Indirect expenses (67) (224) (57) (59) (67) (68) (251) (55) (55) (53) (76) (239) Restructuring costs - direct -- 10 -- (22) (4) 9 (17) (8) (23) (9) (6) (46) - indirect 2 (26) 1 (1) (3) (1) (4) -- (1) (3) 2 (2) Litigation and conduct costs 24 24 -- 13 -- 5 18 -- (118) -- (93) (211) Operating expenses (126) (523) (135) (148) (160) (147) (590) (144) (258) (150) (266) (818) Operating profit/(loss) before impairment releases 66 226 50 35 68 15 168 61 (86) 21 (110) (114) Impairment releases 89 380 33 72 75 14 194 17 17 48 56 138 Operating profit/(loss) 155 606 83 107 143 29 362 78 (69) 69 (54) 24 Memo: Total income - adjusted (1) 192 749 185 183 228 162 758 201 172 171 157 701 Operating expenses - adjusted (2) (152) (531) (136) (138) (153) (160) (587) (136) (116) (138) (169) (559) Operating profit - adjusted (1,2) 129 598 82 117 150 16 365 82 73 81 44 280 Analysis of income by business Corporate 62 230 50 47 52 53 202 73 55 49 38 215 Retail 93 361 103 109 126 105 443 130 121 112 116 479 Other 37 158 32 27 50 4 113 2 (4) 10 2 10 Total income 192 749 185 183 228 162 758 205 172 171 156 704 Analysis of impairments by sector Mortgages (50) (212) (25) (53) (51) 29 (100) 2 (3) 75 (39) 35 Commercial real estate - investment (6) (10) 1 4 (2) 4 7 (6) -- (23) (1) (30) - development 5 (3) -- 5 (3) (2) -- (2) (6) (16) (1) (25) Other lending (38) (155) (9) (28) (19) (45) (101) (11) (8) (84) (15) (118) Total impairment (releases) (89) (380) (33) (72) (75) (14) (194) (17) (17) (48) (56) (138) Loan impairment charge/release as % of gross customer loans and advances (excluding reverse repurchase agreements) by sector Mortgages (1,0%) (1,1%) (0,5%) (1,1%) (1,1%) 0,6% (0,5%) -- (0,1%) 1,6% (0,9%) 0,2% Commercial real estate - investment (1,8%) (0,8%) 0,3% 1,2% (0,7%) 1,8% 0,8% (2,0%) -- (8,4%) (0,5%) (3,8%) - development 6,7% (1,0%) -- 5,0% (3,0%) (2,7%) -- (1,1%) (4,8%) (12,8%) (1,3%) (8,3%) Other lending (2,9%) (3,0%) (0,8%) (2,3%) (1,5%) (3,4%) (1,9%) (0,8%) (0,6%) (6,6%) (1,3%) (2,6%) Total (1,3%) (1,4%) (0,5%) (1,1%) (1,2%) (0,2%) (0,8%) (0,3%) (0,3%) (0,8%) (1,0%) (0,6%) Performance ratios Return on equity (3) 19,8% 18,6% 10,1% 12,6% 16,7% 3,0% 10,6% 8,8% (8,2%) 7,8% (5,8%) 0,7% Return on equity - adjusted (1,2,3) 16,4% 18,4% 9,9% 13,9% 17,5% 1,4% 10,6% 9,2% 9,0% 9,9% 5,4% 8,4% Net interest margin 1,90% 1,92% 1,66% 1,65% 1,52% 1,45% 1,57% 1,75% 1,54% 1,62% 1,59% 1,62% Cost:income ratio 64% 70% 72% 81% 70% 92% 78% 70% 150% 90% 165% 116% Cost:income ratio - adjusted (1,2) 78% 71% 73% 75% 67% 101% 78% 67% 67% 80% 106% 80% Notes: (1) Excluding own credit adjustments. (2) Excluding restructuring costs, litigation and conduct costs. (3) Return on equity is based on segmental operating profit after tax adjusted for preference dividends divided by average notional equity based on 11% of the monthly average of segmental RWAes, assuming 15% tax rate. RBS Group - Q4 2016 Financial Supplement Page 28
 Financial Supplement Page 27 Page 29