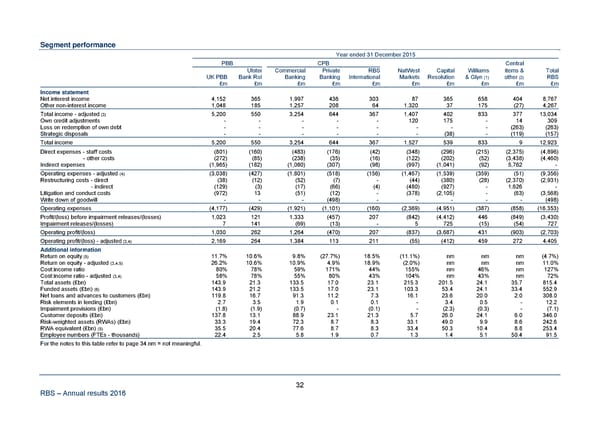
Segment performance Year ended 31 December 2015 PBB CPB Central Ulster Commercial Private RBS NatWest Capital Williams items & Total UK PBB Bank RoI Banking Banking International Markets Resolution & Glyn (1) other (2) RBS £m £m £m £m £m £m £m £m £m £m Income statement Net interest income 4,152 365 1,997 436 303 87 365 658 404 8,767 Other non-interest income 1,048 185 1,257 208 64 1,320 37 175 (27) 4,267 Total income - adjusted (3) 5,200 550 3,254 644 367 1,407 402 833 377 13,034 Own credit adjustments - - - - - 120 175 - 14 309 Loss on redemption of own debt - - - - - - - - (263) (263) Strategic disposals - - - - - - (38) - (119) (157) Total income 5,200 550 3,254 644 367 1,527 539 833 9 12,923 Direct expenses - staff costs (801) (160) (483) (176) (42) (348) (296) (215) (2,375) (4,896) - other costs (272) (85) (238) (35) (16) (122) (202) (52) (3,438) (4,460) Indirect expenses (1,965) (182) (1,080) (307) (98) (997) (1,041) (92) 5,762 - Operating expenses - adjusted (4) (3,038) (427) (1,801) (518) (156) (1,467) (1,539) (359) (51) (9,356) Restructuring costs - direct (38) (12) (52) (7) - (44) (380) (28) (2,370) (2,931) - indirect (129) (3) (17) (66) (4) (480) (927) - 1,626 - Litigation and conduct costs (972) 13 (51) (12) - (378) (2,105) - (63) (3,568) Write down of goodwill - - - (498) - - - - - (498) Operating expenses (4,177) (429) (1,921) (1,101) (160) (2,369) (4,951) (387) (858) (16,353) Profit/(loss) before impairment releases/(losses) 1,023 121 1,333 (457) 207 (842) (4,412) 446 (849) (3,430) Impairment releases/(losses) 7 141 (69) (13) - 5 725 (15) (54) 727 Operating profit/(loss) 1,030 262 1,264 (470) 207 (837) (3,687) 431 (903) (2,703) Operating profit/(loss) - adjusted (3,4) 2,169 264 1,384 113 211 (55) (412) 459 272 4,405 Additional information Return on equity (5) 11.7% 10.6% 9.8% (27.7%) 18.5% (11.1%) nm nm nm (4.7%) Return on equity - adjusted (3,4,5) 26.2% 10.6% 10.9% 4.9% 18.9% (2.0%) nm nm nm 11.0% Cost:income ratio 80% 78% 59% 171% 44% 155% nm 46% nm 127% Cost:income ratio - adjusted (3,4) 58% 78% 55% 80% 43% 104% nm 43% nm 72% Total assets (£bn) 143.9 21.3 133.5 17.0 23.1 215.3 201.5 24.1 35.7 815.4 Funded assets (£bn) (6) 143.9 21.2 133.5 17.0 23.1 103.3 53.4 24.1 33.4 552.9 Net loans and advances to customers (£bn) 119.8 16.7 91.3 11.2 7.3 16.1 23.6 20.0 2.0 308.0 Risk elements in lending (£bn) 2.7 3.5 1.9 0.1 0.1 - 3.4 0.5 - 12.2 Impairment provisions (£bn) (1.8) (1.9) (0.7) - (0.1) - (2.3) (0.3) - (7.1) Customer deposits (£bn) 137.8 13.1 88.9 23.1 21.3 5.7 26.0 24.1 6.0 346.0 Risk-weighted assets (RWAs) (£bn) 33.3 19.4 72.3 8.7 8.3 33.1 49.0 9.9 8.6 242.6 RWA equivalent (£bn) (5) 35.5 20.4 77.6 8.7 8.3 33.4 50.3 10.4 8.8 253.4 Employee numbers (FTEs - thousands) 22.4 2.5 5.8 1.9 0.7 1.3 1.4 5.1 50.4 91.5 For the notes to this table refer to page 34.nm = not meaningful. 32 RBS – Annual results 2016
 Annual Results Announcement Page 37 Page 39