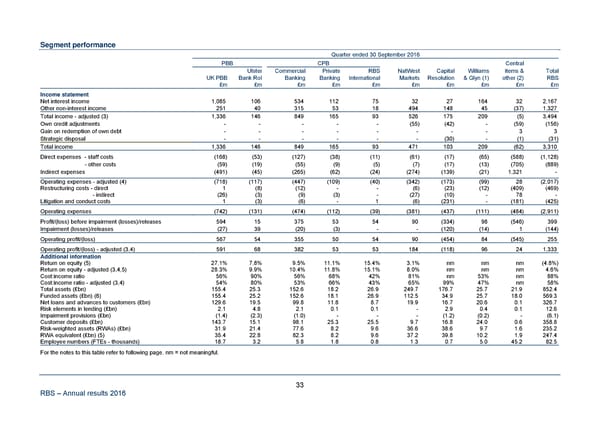
Segment performance Quarter ended 30 September 2016 PBB CPB Central Ulster Commercial Private RBS NatWest Capital Williams items & Total UK PBB Bank RoI Banking Banking International Markets Resolution & Glyn (1) other (2) RBS £m £m £m £m £m £m £m £m £m £m Income statement Net interest income 1,085 106 534 112 75 32 27 164 32 2,167 Other non-interest income 251 40 315 53 18 494 148 45 (37) 1,327 Total income - adjusted (3) 1,336 146 849 165 93 526 175 209 (5) 3,494 Own credit adjustments - - - - - (55) (42) - (59) (156) Gain on redemption of own debt - - - - - - - - 3 3 Strategic disposal - - - - - - (30) - (1) (31) Total income 1,336 146 849 165 93 471 103 209 (62) 3,310 Direct expenses - staff costs (168) (53) (127) (38) (11) (61) (17) (65) (588) (1,128) - other costs (59) (19) (55) (9) (5) (7) (17) (13) (705) (889) Indirect expenses (491) (45) (265) (62) (24) (274) (139) (21) 1,321 - Operating expenses - adjusted (4) (718) (117) (447) (109) (40) (342) (173) (99) 28 (2,017) Restructuring costs - direct 1 (8) (12) - - (6) (23) (12) (409) (469) - indirect (26) (3) (9) (3) - (27) (10) - 78 - Litigation and conduct costs 1 (3) (6) - 1 (6) (231) - (181) (425) Operating expenses (742) (131) (474) (112) (39) (381) (437) (111) (484) (2,911) Profit/(loss) before impairment (losses)/releases 594 15 375 53 54 90 (334) 98 (546) 399 Impairment (losses)/releases (27) 39 (20) (3) - - (120) (14) 1 (144) Operating profit/(loss) 567 54 355 50 54 90 (454) 84 (545) 255 Operating profit/(loss) - adjusted (3,4) 591 68 382 53 53 184 (118) 96 24 1,333 Additional information Return on equity (5) 27.1% 7.8% 9.5% 11.1% 15.4% 3.1% nm nm nm (4.8%) Return on equity - adjusted (3,4,5) 28.3% 9.9% 10.4% 11.8% 15.1% 8.0% nm nm nm 4.6% Cost:income ratio 56% 90% 56% 68% 42% 81% nm 53% nm 88% Cost:income ratio - adjusted (3,4) 54% 80% 53% 66% 43% 65% 99% 47% nm 58% Total assets (£bn) 155.4 25.3 152.6 18.2 26.9 249.7 176.7 25.7 21.9 852.4 Funded assets (£bn) (6) 155.4 25.2 152.6 18.1 26.9 112.5 34.9 25.7 18.0 569.3 Net loans and advances to customers (£bn) 129.6 19.5 99.8 11.8 8.7 19.9 16.7 20.6 0.1 326.7 Risk elements in lending (£bn) 2.1 4.8 2.1 0.1 0.1 - 2.9 0.4 0.1 12.6 Impairment provisions (£bn) (1.4) (2.3) (1.0) - - - (1.2) (0.2) - (6.1) Customer deposits (£bn) 143.7 15.1 98.1 25.3 25.5 9.7 16.8 24.0 0.6 358.8 Risk-weighted assets (RWAs) (£bn) 31.9 21.4 77.6 8.2 9.6 36.6 38.6 9.7 1.6 235.2 RWA equivalent (£bn) (5) 35.4 22.8 82.3 8.2 9.6 37.2 39.8 10.2 1.9 247.4 Employee numbers (FTEs - thousands) 18.7 3.2 5.8 1.8 0.8 1.3 0.7 5.0 45.2 82.5 For the notes to this table refer to following page. nm = not meaningful. 33 RBS – Annual results 2016
 Annual Results Announcement Page 38 Page 40