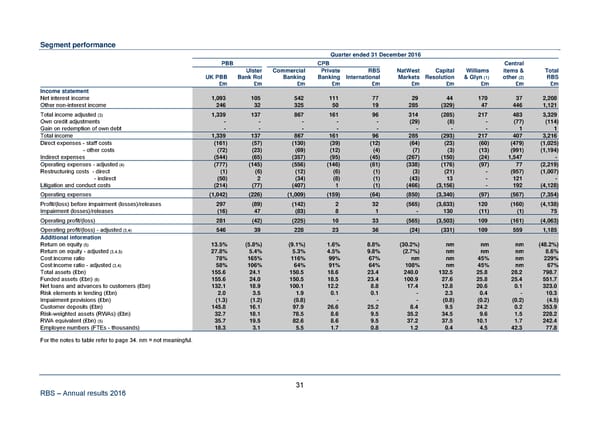
Segment performance Quarter ended 31 December 2016 PBB CPB Central Ulster Commercial Private RBS NatWest Capital Williams items & Total UK PBB Bank RoI Banking Banking International Markets Resolution & Glyn (1) other (2) RBS £m £m £m £m £m £m £m £m £m £m Income statement Net interest income 1,093 105 542 111 77 29 44 170 37 2,208 Other non-interest income 246 32 325 50 19 285 (329) 47 446 1,121 Total income adjusted (3) 1,339 137 867 161 96 314 (285) 217 483 3,329 Own credit adjustments - - - - - (29) (8) - (77) (114) Gain on redemption of own debt - - - - - - - - 1 1 Total income 1,339 137 867 161 96 285 (293) 217 407 3,216 Direct expenses - staff costs (161) (57) (130) (39) (12) (64) (23) (60) (479) (1,025) - other costs (72) (23) (69) (12) (4) (7) (3) (13) (991) (1,194) Indirect expenses (544) (65) (357) (95) (45) (267) (150) (24) 1,547 - Operating expenses - adjusted (4) (777) (145) (556) (146) (61) (338) (176) (97) 77 (2,219) Restructuring costs - direct (1) (6) (12) (6) (1) (3) (21) - (957) (1,007) - indirect (50) 2 (34) (8) (1) (43) 13 - 121 - Litigation and conduct costs (214) (77) (407) 1 (1) (466) (3,156) - 192 (4,128) Operating expenses (1,042) (226) (1,009) (159) (64) (850) (3,340) (97) (567) (7,354) Profit/(loss) before impairment (losses)/releases 297 (89) (142) 2 32 (565) (3,633) 120 (160) (4,138) Impairment (losses)/releases (16) 47 (83) 8 1 - 130 (11) (1) 75 Operating profit/(loss) 281 (42) (225) 10 33 (565) (3,503) 109 (161) (4,063) Operating profit/(loss) - adjusted (3,4) 546 39 228 23 36 (24) (331) 109 559 1,185 Additional information Return on equity (5) 13.5% (5.8%) (9.1%) 1.6% 8.8% (30.2%) nm nm nm (48.2%) Return on equity - adjusted (3,4,5) 27.8% 5.4% 5.3% 4.5% 9.8% (2.7%) nm nm nm 8.6% Cost:income ratio 78% 165% 116% 99% 67% nm nm 45% nm 229% Cost:income ratio - adjusted (3,4) 58% 106% 64% 91% 64% 108% nm 45% nm 67% Total assets (£bn) 155.6 24.1 150.5 18.6 23.4 240.0 132.5 25.8 28.2 798.7 Funded assets (£bn) (6) 155.6 24.0 150.5 18.5 23.4 100.9 27.6 25.8 25.4 551.7 Net loans and advances to customers (£bn) 132.1 18.9 100.1 12.2 8.8 17.4 12.8 20.6 0.1 323.0 Risk elements in lending (£bn) 2.0 3.5 1.9 0.1 0.1 - 2.3 0.4 - 10.3 Impairment provisions (£bn) (1.3) (1.2) (0.8) - - - (0.8) (0.2) (0.2) (4.5) Customer deposits (£bn) 145.8 16.1 97.9 26.6 25.2 8.4 9.5 24.2 0.2 353.9 Risk-weighted assets (RWAs) (£bn) 32.7 18.1 78.5 8.6 9.5 35.2 34.5 9.6 1.5 228.2 RWA equivalent (£bn) (5) 35.7 19.5 82.6 8.6 9.5 37.2 37.5 10.1 1.7 242.4 Employee numbers (FTEs - thousands) 18.3 3.1 5.5 1.7 0.8 1.2 0.4 4.5 42.3 77.8 For the notes to table refer to page 34. nm = not meaningful. 31 RBS – Annual results 2016
 Annual Results Announcement Page 36 Page 38