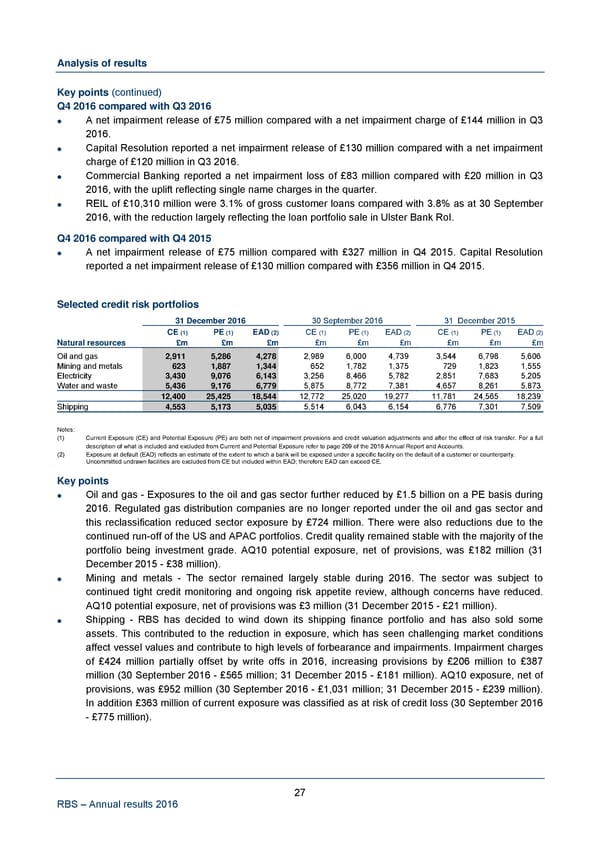
Analysis of results Key points (continued) Q4 2016 compared with Q3 2016 A net impairment release of £75 million compared with a net impairment charge of £144 million in Q3 2016. Capital Resolution reported a net impairment release of £130 million compared with a net impairment charge of £120 million in Q3 2016. Commercial Banking reported a net impairment loss of £83 million compared with £20 million in Q3 2016, with the uplift reflecting single name charges in the quarter. REIL of £10,310 million were 3.1% of gross customer loans compared with 3.8% as at 30 September 2016, with the reduction largely reflecting the loan portfolio sale in Ulster Bank RoI. Q4 2016 compared with Q4 2015 A net impairment release of £75 million compared with £327 million in Q4 2015. Capital Resolution reported a net impairment release of £130 million compared with £356 million in Q4 2015. Selected credit risk portfolios 31 December 2016 30 September 2016 31 December 2015 CE (1) PE (1) EAD (2) CE (1) PE (1) EAD (2) CE (1) PE (1) EAD (2) Natural resources £m £m £m £m £m £m £m £m £m Oil and gas 2,911 5,286 4,278 2,989 6,000 4,739 3,544 6,798 5,606 Mining and metals 623 1,887 1,344 652 1,782 1,375 729 1,823 1,555 Electricity 3,430 9,076 6,143 3,256 8,466 5,782 2,851 7,683 5,205 Water and waste 5,436 9,176 6,779 5,875 8,772 7,381 4,657 8,261 5,873 12,400 25,425 18,544 12,772 25,020 19,277 11,781 24,565 18,239 Shipping 4,553 5,173 5,035 5,514 6,043 6,154 6,776 7,301 7,509 Notes: (1) Current Exposure (CE) and Potential Exposure (PE) are both net of impairment provisions and credit valuation adjustments and after the effect of risk transfer. For a full description of what is included and excluded from Current and Potential Exposure refer to page 209 of the 2016 Annual Report and Accounts. (2) Exposure at default (EAD) reflects an estimate of the extent to which a bank will be exposed under a specific facility on the default of a customer or counterparty. Uncommitted undrawn facilities are excluded from CE but included within EAD; therefore EAD can exceed CE. Key points Oil and gas - Exposures to the oil and gas sector further reduced by £1.5 billion on a PE basis during 2016. Regulated gas distribution companies are no longer reported under the oil and gas sector and this reclassification reduced sector exposure by £724 million. There were also reductions due to the continued run-off of the US and APAC portfolios. Credit quality remained stable with the majority of the portfolio being investment grade. AQ10 potential exposure, net of provisions, was £182 million (31 December 2015 - £38 million). Mining and metals - The sector remained largely stable during 2016. The sector was subject to continued tight credit monitoring and ongoing risk appetite review, although concerns have reduced. AQ10 potential exposure, net of provisions was £3 million (31 December 2015 - £21 million). Shipping - RBS has decided to wind down its shipping finance portfolio and has also sold some assets. This contributed to the reduction in exposure, which has seen challenging market conditions affect vessel values and contribute to high levels of forbearance and impairments. Impairment charges of £424 million partially offset by write offs in 2016, increasing provisions by £206 million to £387 million (30 September 2016 - £565 million; 31 December 2015 - £181 million). AQ10 exposure, net of provisions, was £952 million (30 September 2016 - £1,031 million; 31 December 2015 - £239 million). In addition £363 million of current exposure was classified as at risk of credit loss (30 September 2016 - £775 million). 27 RBS – Annual results 2016
 Annual Results Announcement Page 31 Page 33