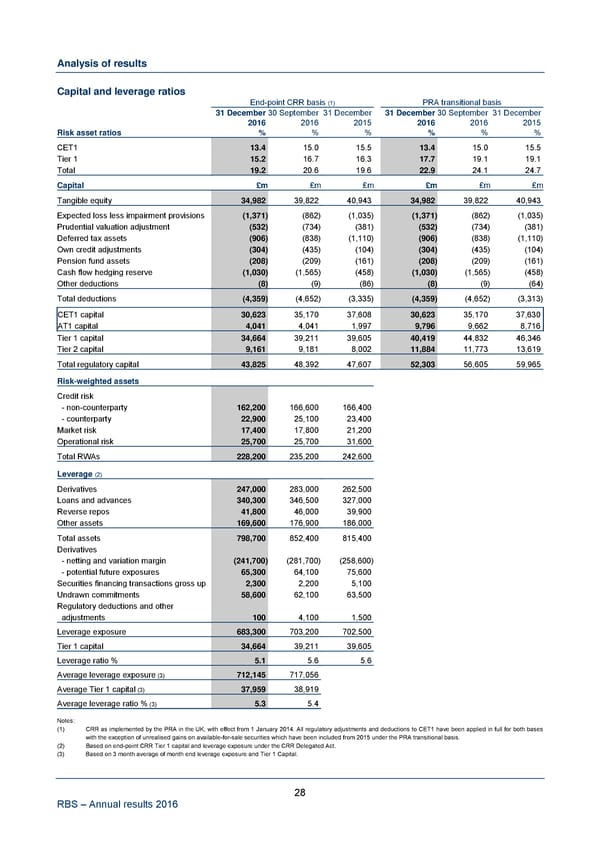
Analysis of results Capital and leverage ratios End-point CRR basis (1) PRA transitional basis 31 December 30 September 31 December 31 December 30 September 31 December 2016 2016 2015 2016 2016 2015 Risk asset ratios % % % % % % CET1 13.4 15.0 15.5 13.4 15.0 15.5 Tier 1 15.2 16.7 16.3 17.7 19.1 19.1 Total 19.2 20.6 19.6 22.9 24.1 24.7 Capital £m £m £m £m £m £m Tangible equity 34,982 39,822 40,943 34,982 39,822 40,943 Expected loss less impairment provisions (1,371) (862) (1,035) (1,371) (862) (1,035) Prudential valuation adjustment (532) (734) (381) (532) (734) (381) Deferred tax assets (906) (838) (1,110) (906) (838) (1,110) Own credit adjustments (304) (435) (104) (304) (435) (104) Pension fund assets (208) (209) (161) (208) (209) (161) Cash flow hedging reserve (1,030) (1,565) (458) (1,030) (1,565) (458) Other deductions (8) (9) (86) (8) (9) (64) Total deductions (4,359) (4,652) (3,335) (4,359) (4,652) (3,313) CET1 capital 30,623 35,170 37,608 30,623 35,170 37,630 AT1 capital 4,041 4,041 1,997 9,796 9,662 8,716 Tier 1 capital 34,664 39,211 39,605 40,419 44,832 46,346 Tier 2 capital 9,161 9,181 8,002 11,884 11,773 13,619 Total regulatory capital 43,825 48,392 47,607 52,303 56,605 59,965 Risk-weighted assets Credit risk - non-counterparty 162,200 166,600 166,400 - counterparty 22,900 25,100 23,400 Market risk 17,400 17,800 21,200 Operational risk 25,700 25,700 31,600 Total RWAs 228,200 235,200 242,600 Leverage (2) Derivatives 247,000 283,000 262,500 Loans and advances 340,300 346,500 327,000 Reverse repos 41,800 46,000 39,900 Other assets 169,600 176,900 186,000 Total assets 798,700 852,400 815,400 Derivatives - netting and variation margin (241,700) (281,700) (258,600) - potential future exposures 65,300 64,100 75,600 Securities financing transactions gross up 2,300 2,200 5,100 Undrawn commitments 58,600 62,100 63,500 Regulatory deductions and other adjustments 100 4,100 1,500 Leverage exposure 683,300 703,200 702,500 Tier 1 capital 34,664 39,211 39,605 Leverage ratio % 5.1 5.6 5.6 Average leverage exposure (3) 712,145 717,056 Average Tier 1 capital (3) 37,959 38,919 Average leverage ratio % (3) 5.3 5.4 Notes: (1) CRR as implemented by the PRA in the UK, with effect from 1 January 2014. All regulatory adjustments and deductions to CET1 have been applied in full for both bases with the exception of unrealised gains on available-for-sale securities which have been included from 2015 under the PRA transitional basis. (2) Based on end-point CRR Tier 1 capital and leverage exposure under the CRR Delegated Act. (3) Based on 3 month average of month end leverage exposure and Tier 1 Capital. 28 RBS – Annual results 2016
 Annual Results Announcement Page 32 Page 34