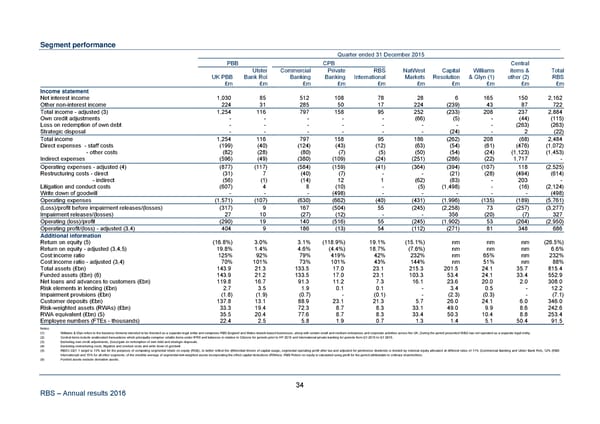
Segment performance Quarter ended 31 December 2015 PBB CPB Central Ulster Commercial Private RBS NatWest Capital Williams items & Total UK PBB Bank RoI Banking Banking International Markets Resolution & Glyn (1) other (2) RBS £m £m £m £m £m £m £m £m £m £m Income statement Net interest income 1,030 85 512 108 78 28 6 165 150 2,162 Other non-interest income 224 31 285 50 17 224 (239) 43 87 722 Total income - adjusted (3) 1,254 116 797 158 95 252 (233) 208 237 2,884 Own credit adjustments - - - - - (66) (5) - (44) (115) Loss on redemption of own debt - - - - - - - - (263) (263) Strategic disposal - - - - - - (24) - 2 (22) Total income 1,254 116 797 158 95 186 (262) 208 (68) 2,484 Direct expenses - staff costs (199) (40) (124) (43) (12) (63) (54) (61) (476) (1,072) - other costs (82) (28) (80) (7) (5) (50) (54) (24) (1,123) (1,453) Indirect expenses (596) (49) (380) (109) (24) (251) (286) (22) 1,717 - Operating expenses - adjusted (4) (877) (117) (584) (159) (41) (364) (394) (107) 118 (2,525) Restructuring costs - direct (31) 7 (40) (7) - - (21) (28) (494) (614) - indirect (56) (1) (14) 12 1 (62) (83) - 203 - Litigation and conduct costs (607) 4 8 (10) - (5) (1,498) - (16) (2,124) Write down of goodwill - - - (498) - - - - - (498) Operating expenses (1,571) (107) (630) (662) (40) (431) (1,996) (135) (189) (5,761) (Loss)/profit before impairment releases/(losses) (317) 9 167 (504) 55 (245) (2,258) 73 (257) (3,277) Impairment releases/(losses) 27 10 (27) (12) - - 356 (20) (7) 327 Operating (loss)/profit (290) 19 140 (516) 55 (245) (1,902) 53 (264) (2,950) Operating profit/(loss) - adjusted (3,4) 404 9 186 (13) 54 (112) (271) 81 348 686 Additional information Return on equity (5) (16.8%) 3.0% 3.1% (118.9%) 19.1% (15.1%) nm nm nm (26.5%) Return on equity - adjusted (3,4,5) 19.8% 1.4% 4.6% (4.4%) 18.7% (7.6%) nm nm nm 6.6% Cost:income ratio 125% 92% 79% 419% 42% 232% nm 65% nm 232% Cost:income ratio - adjusted (3,4) 70% 101% 73% 101% 43% 144% nm 51% nm 88% Total assets (£bn) 143.9 21.3 133.5 17.0 23.1 215.3 201.5 24.1 35.7 815.4 Funded assets (£bn) (6) 143.9 21.2 133.5 17.0 23.1 103.3 53.4 24.1 33.4 552.9 Net loans and advances to customers (£bn) 119.8 16.7 91.3 11.2 7.3 16.1 23.6 20.0 2.0 308.0 Risk elements in lending (£bn) 2.7 3.5 1.9 0.1 0.1 - 3.4 0.5 - 12.2 Impairment provisions (£bn) (1.8) (1.9) (0.7) - (0.1) - (2.3) (0.3) - (7.1) Customer deposits (£bn) 137.8 13.1 88.9 23.1 21.3 5.7 26.0 24.1 6.0 346.0 Risk-weighted assets (RWAs) (£bn) 33.3 19.4 72.3 8.7 8.3 33.1 49.0 9.9 8.6 242.6 RWA equivalent (£bn) (5) 35.5 20.4 77.6 8.7 8.3 33.4 50.3 10.4 8.8 253.4 Employee numbers (FTEs - thousands) 22.4 2.5 5.8 1.9 0.7 1.3 1.4 5.1 50.4 91.5 Notes: (1) Williams & Glyn refers to the business formerly intended to be divested as a separate legal entity and comprises RBS England and Wales branch-based businesses, along with certain small and medium enterprises and corporate activities across the UK. During the period presented W&G has not operated as a separate legal entity. (2) Central items include unallocated transactions which principally comprise volatile items under IFRS and balances in relation to Citizens for periods prior to HY 2015 and International private banking for periods from Q1 2015 to Q1 2016. (3) Excluding own credit adjustments, (loss)/gain on redemption of own debt and strategic disposals. (4) Excluding restructuring costs, litigation and conduct costs and write down of goodwill. (5) RBS’s CET 1 target is 13% but for the purposes of computing segmental return on equity (ROE), to better reflect the differential drivers of capital usage, segmental operating profit after tax and adjusted for preference dividends is divided by notional equity allocated at different rates of 11% (Commercial Banking and Ulster Bank RoI), 12% (RBS International) and 15% for all other segments, of the monthly average of segmental risk-weighted assets incorporating the effect capital deductions (RWAes). RBS Return on equity is calculated using profit for the period attributable to ordinary shareholders. (6) Funded assets exclude derivative assets. 34 RBS – Annual results 2016
 Annual Results Announcement Page 39 Page 41