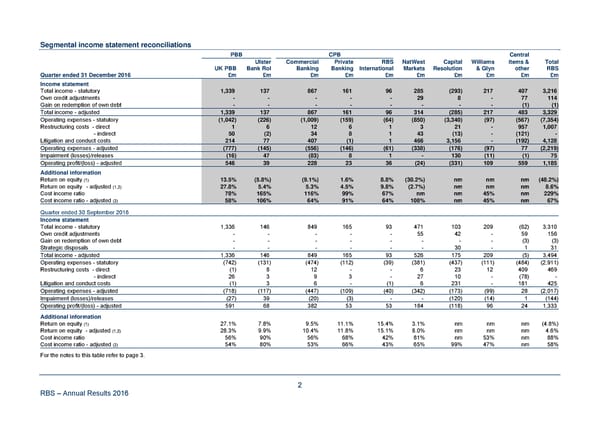
Segmental income statement reconciliations PBB CPB Central Ulster Commercial Private RBS NatWest Capital Williams items & Total UK PBB Bank RoI Banking Banking International Markets Resolution & Glyn other RBS Quarter ended 31 December 2016 £m £m £m £m £m £m £m £m £m £m Income statement Total income - statutory 1,339 137 867 161 96 285 (293) 217 407 3,216 Own credit adjustments - - - - - 29 8 - 77 114 Gain on redemption of own debt - - - - - - - - (1) (1) Total income - adjusted 1,339 137 867 161 96 314 (285) 217 483 3,329 Operating expenses - statutory (1,042) (226) (1,009) (159) (64) (850) (3,340) (97) (567) (7,354) Restructuring costs - direct 1 6 12 6 1 3 21 - 957 1,007 - indirect 50 (2) 34 8 1 43 (13) - (121) - Litigation and conduct costs 214 77 407 (1) 1 466 3,156 - (192) 4,128 Operating expenses - adjusted (777) (145) (556) (146) (61) (338) (176) (97) 77 (2,219) Impairment (losses)/releases (16) 47 (83) 8 1 - 130 (11) (1) 75 Operating profit/(loss) - adjusted 546 39 228 23 36 (24) (331) 109 559 1,185 Additional information Return on equity (1) 13.5% (5.8%) (9.1%) 1.6% 8.8% (30.2%) nm nm nm (48.2%) Return on equity - adjusted (1,2) 27.8% 5.4% 5.3% 4.5% 9.8% (2.7%) nm nm nm 8.6% Cost income ratio 78% 165% 116% 99% 67% nm nm 45% nm 229% Cost income ratio - adjusted (2) 58% 106% 64% 91% 64% 108% nm 45% nm 67% Quarter ended 30 September 2016 Income statement Total income - statutory 1,336 146 849 165 93 471 103 209 (62) 3,310 Own credit adjustments - - - - - 55 42 - 59 156 Gain on redemption of own debt - - - - - - - - (3) (3) Strategic disposals - - - - - - 30 - 1 31 Total income - adjusted 1,336 146 849 165 93 526 175 209 (5) 3,494 Operating expenses - statutory (742) (131) (474) (112) (39) (381) (437) (111) (484) (2,911) Restructuring costs - direct (1) 8 12 - - 6 23 12 409 469 - indirect 26 3 9 3 - 27 10 - (78) - Litigation and conduct costs (1) 3 6 - (1) 6 231 - 181 425 Operating expenses - adjusted (718) (117) (447) (109) (40) (342) (173) (99) 28 (2,017) Impairment (losses)/releases (27) 39 (20) (3) - - (120) (14) 1 (144) Operating profit/(loss) - adjusted 591 68 382 53 53 184 (118) 96 24 1,333 Additional information Return on equity (1) 27.1% 7.8% 9.5% 11.1% 15.4% 3.1% nm nm nm (4.8%) Return on equity - adjusted (1,2) 28.3% 9.9% 10.4% 11.8% 15.1% 8.0% nm nm nm 4.6% Cost income ratio 56% 90% 56% 68% 42% 81% nm 53% nm 88% Cost income ratio - adjusted (2) 54% 80% 53% 66% 43% 65% 99% 47% nm 58% For the notes to this table refer to page 3. RBS – Annual Results 2016 2
 Annual Results Announcement Page 77 Page 79