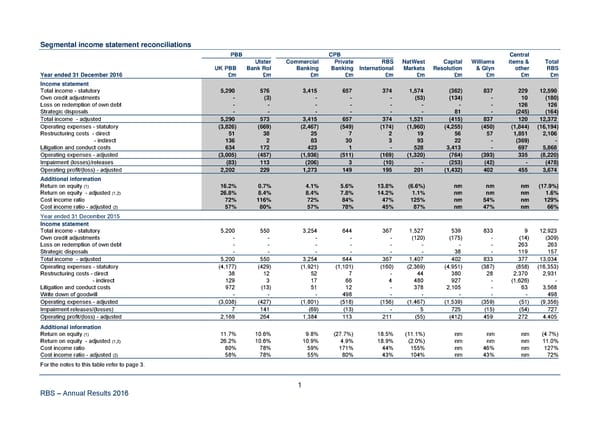
Segmental income statement reconciliations PBB CPB Central Ulster Commercial Private RBS NatWest Capital Williams items & Total UK PBB Bank RoI Banking Banking International Markets Resolution & Glyn other RBS Year ended 31 December 2016 £m £m £m £m £m £m £m £m £m £m Income statement Total income - statutory 5,290 576 3,415 657 374 1,574 (362) 837 229 12,590 Own credit adjustments - (3) - - - (53) (134) - 10 (180) Loss on redemption of own debt - - - - - - - - 126 126 Strategic disposals - - - - - - 81 - (245) (164) Total income - adjusted 5,290 573 3,415 657 374 1,521 (415) 837 120 12,372 Operating expenses - statutory (3,826) (669) (2,467) (549) (174) (1,960) (4,255) (450) (1,844) (16,194) Restructuring costs - direct 51 38 25 7 2 19 56 57 1,851 2,106 - indirect 136 2 83 30 3 93 22 - (369) - Litigation and conduct costs 634 172 423 1 - 528 3,413 - 697 5,868 Operating expenses - adjusted (3,005) (457) (1,936) (511) (169) (1,320) (764) (393) 335 (8,220) Impairment (losses)/releases (83) 113 (206) 3 (10) - (253) (42) - (478) Operating profit/(loss) - adjusted 2,202 229 1,273 149 195 201 (1,432) 402 455 3,674 Additional information Return on equity (1) 16.2% 0.7% 4.1% 5.6% 13.8% (6.6%) nm nm nm (17.9%) Return on equity - adjusted (1,2) 26.8% 8.4% 8.4% 7.8% 14.2% 1.1% nm nm nm 1.6% Cost income ratio 72% 116% 72% 84% 47% 125% nm 54% nm 129% Cost income ratio - adjusted (2) 57% 80% 57% 78% 45% 87% nm 47% nm 66% Year ended 31 December 2015 Income statement Total income - statutory 5,200 550 3,254 644 367 1,527 539 833 9 12,923 Own credit adjustments - - - - - (120) (175) - (14) (309) Loss on redemption of own debt - - - - - - - - 263 263 Strategic disposals - - - - - - 38 - 119 157 Total income - adjusted 5,200 550 3,254 644 367 1,407 402 833 377 13,034 Operating expenses - statutory (4,177) (429) (1,921) (1,101) (160) (2,369) (4,951) (387) (858) (16,353) Restructuring costs - direct 38 12 52 7 - 44 380 28 2,370 2,931 - indirect 129 3 17 66 4 480 927 - (1,626) - Litigation and conduct costs 972 (13) 51 12 - 378 2,105 - 63 3,568 Write down of goodwill - - - 498 - - - - - 498 Operating expenses - adjusted (3,038) (427) (1,801) (518) (156) (1,467) (1,539) (359) (51) (9,356) Impairment releases/(losses) 7 141 (69) (13) - 5 725 (15) (54) 727 Operating profit/(loss) - adjusted 2,169 264 1,384 113 211 (55) (412) 459 272 4,405 Additional information Return on equity (1) 11.7% 10.6% 9.8% (27.7%) 18.5% (11.1%) nm nm nm (4.7%) Return on equity - adjusted (1,2) 26.2% 10.6% 10.9% 4.9% 18.9% (2.0%) nm nm nm 11.0% Cost income ratio 80% 78% 59% 171% 44% 155% nm 46% nm 127% Cost income ratio - adjusted (2) 58% 78% 55% 80% 43% 104% nm 43% nm 72% For the notes to this table refer to page 3. RBS – Annual Results 2016 1
 Annual Results Announcement Page 76 Page 78