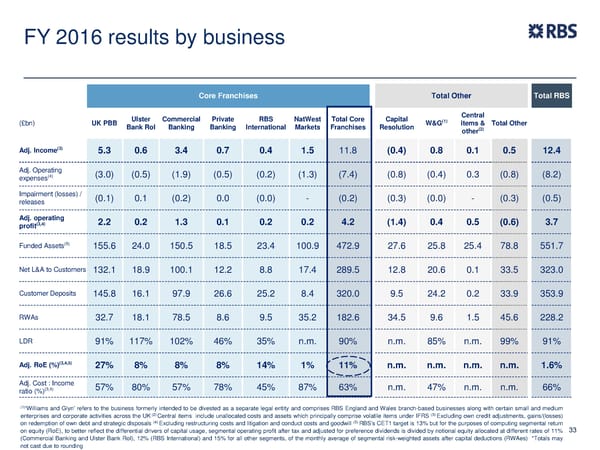
FY 2016 results by business Core Franchises Total Other Total RBS Ulster Commercial Private RBS NatWest Total Core Capital Central (£bn) UK PBB Bank RoI Banking Banking International Markets Franchises Resolution W&G(1) items & Total Other (2) other (3) Adj. Income 5.3 0.6 3.4 0.7 0.4 1.5 11.8 (0.4) 0.8 0.1 0.5 12.4 Adj. Operating (3.0) (0.5) (1.9) (0.5) (0.2) (1.3) (7.4) (0.8) (0.4) 0.3 (0.8) (8.2) expenses(4) Impairment (losses) / (0.1) 0.1 (0.2) 0.0 (0.0) - (0.2) (0.3) (0.0) - (0.3) (0.5) releases Adj. operating 2.2 0.2 1.3 0.1 0.2 0.2 4.2 (1.4) 0.4 0.5 (0.6) 3.7 (3,4) profit Funded Assets(5) 155.6 24.0 150.5 18.5 23.4 100.9 472.9 27.6 25.8 25.4 78.8 551.7 Net L&A to Customers 132.1 18.9 100.1 12.2 8.8 17.4 289.5 12.8 20.6 0.1 33.5 323.0 Customer Deposits 145.8 16.1 97.9 26.6 25.2 8.4 320.0 9.5 24.2 0.2 33.9 353.9 RWAs 32.7 18.1 78.5 8.6 9.5 35.2 182.6 34.5 9.6 1.5 45.6 228.2 LDR 91% 117% 102% 46% 35% n.m. 90% n.m. 85% n.m. 99% 91% Adj. RoE (%)(3,4,5) 27% 8% 8% 8% 14% 1% 11% n.m. n.m. n.m. n.m. 1.6% Adj. Cost : Income 57% 80% 57% 78% 45% 87% 63% n.m. 47% n.m. n.m. 66% (3,4) ratio (%) (1) ‘Williams and Glyn’ refers to the business formerly intended to be divested as a separate legal entity and comprises RBS England and Wales branch-based businesses along with certain small and medium (2) (3) enterprises and corporate activities across the UK Central items include unallocated costs and assets which principally comprise volatile items under IFRS Excluding own credit adjustments, gains/(losses) on redemption of own debt and strategic disposals (4) Excluding restructuring costs and litigation and conduct costs and goodwill (5) RBS’s CET1 target is 13% but for the purposes of computing segmental return on equity (RoE), to better reflect the differential drivers of capital usage, segmental operating profit after tax and adjusted for preference dividends is divided by notional equity allocated at different rates of 11% 33 (Commercial Banking and Ulster Bank RoI), 12% (RBS International) and 15% for all other segments, of the monthly average of segmental risk-weighted assets after capital deductions (RWAes) *Totals may not cast due to rounding
 FY Results | RBS Group Page 32 Page 34