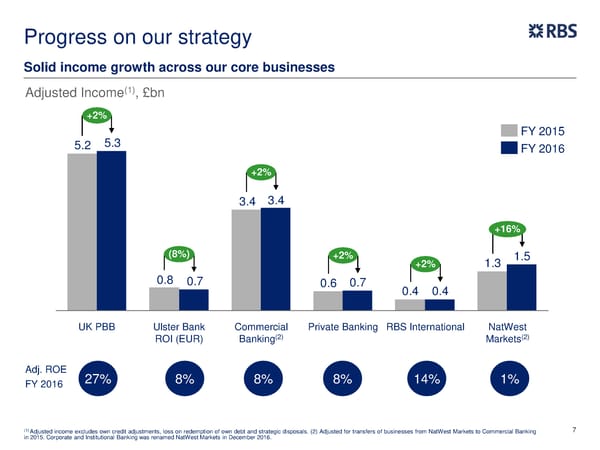
Progress on our strategy Solid income growth across our core businesses Adjusted Income(1), £bn +2% 5.3 FY 2015 5.2 FY 2016 +2% 3.4 3.4 +16% (8%) +2% +2% 1.3 1.5 0.8 0.7 0.6 0.7 0.4 0.4 UK PBB Ulster Bank Commercial Private Banking RBS International NatWest (2) (2) ROI (EUR) Banking Markets Adj. ROE 27% 8% 8% 8% 14% 1% FY 2016 (1) Adjusted income excludes own credit adjustments, loss on redemption of own debt and strategic disposals. (2) Adjusted for transfers of businesses from NatWest Markets to Commercial Banking 7 in 2015. Corporate and Institutional Banking was renamed NatWest Markets in December 2016.
 FY Results | RBS Group Page 7 Page 9