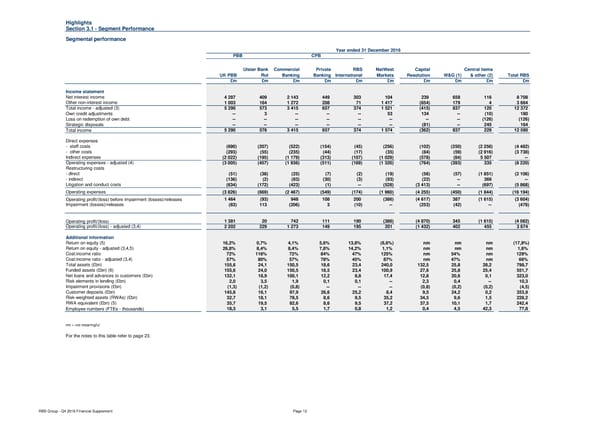
Highlights Section 3.1 - Segment Performance Segmental performance Year ended 31 December 2016 PBB CPB Ulster Bank Commercial Private RBS NatWest Capital Central items UK PBB RoI Banking Banking International Markets Resolution W&G (1) & other (2) Total RBS £m £m £m £m £m £m £m £m £m £m Income statement Net interest income 4 287 409 2 143 449 303 104 239 658 116 8 708 Other non-interest income 1 003 164 1 272 208 71 1 417 (654) 179 4 3 664 Total income - adjusted (3) 5 290 573 3 415 657 374 1 521 (415) 837 120 12 372 Own credit adjustments -- 3 -- -- -- 53 134 -- (10) 180 Loss on redemption of own debt -- -- -- -- -- -- -- -- (126) (126) Strategic disposals -- -- -- -- -- -- (81) -- 245 164 Total income 5 290 576 3 415 657 374 1 574 (362) 837 229 12 590 Direct expenses - staff costs (690) (207) (522) (154) (45) (256) (102) (250) (2 256) (4 482) - other costs (293) (55) (235) (44) (17) (35) (84) (59) (2 916) (3 738) Indirect expenses (2 022) (195) (1 179) (313) (107) (1 029) (578) (84) 5 507 -- Operating expenses - adjusted (4) (3 005) (457) (1 936) (511) (169) (1 320) (764) (393) 335 (8 220) Restructuring costs - direct (51) (38) (25) (7) (2) (19) (56) (57) (1 851) (2 106) - indirect (136) (2) (83) (30) (3) (93) (22) -- 369 -- Litigation and conduct costs (634) (172) (423) (1) -- (528) (3 413) -- (697) (5 868) Operating expenses (3 826) (669) (2 467) (549) (174) (1 960) (4 255) (450) (1 844) (16 194) Operating profit/(loss) before impairment (losses)/releases 1 464 (93) 948 108 200 (386) (4 617) 387 (1 615) (3 604) Impairment (losses)/releases (83) 113 (206) 3 (10) -- (253) (42) -- (478) Operating profit/(loss) 1 381 20 742 111 190 (386) (4 870) 345 (1 615) (4 082) Operating profit/(loss) - adjusted (3,4) 2 202 229 1 273 149 195 201 (1 432) 402 455 3 674 Additional information Return on equity (5) 16,2% 0,7% 4,1% 5,6% 13,8% (6,6%) nm nm nm (17,9%) Return on equity - adjusted (3,4,5) 26,8% 8,4% 8,4% 7,8% 14,2% 1,1% nm nm nm 1,6% Cost:income ratio 72% 116% 72% 84% 47% 125% nm 54% nm 129% Cost:income ratio - adjusted (3,4) 57% 80% 57% 78% 45% 87% nm 47% nm 66% Total assets (£bn) 155,6 24,1 150,5 18,6 23,4 240,0 132,5 25,8 28,2 798,7 Funded assets (£bn) (6) 155,6 24,0 150,5 18,5 23,4 100,9 27,6 25,8 25,4 551,7 Net loans and advances to customers (£bn) 132,1 18,9 100,1 12,2 8,8 17,4 12,8 20,6 0,1 323,0 Risk elements in lending (£bn) 2,0 3,5 1,9 0,1 0,1 -- 2,3 0,4 -- 10,3 Impairment provisions (£bn) (1,3) (1,2) (0,8) -- -- -- (0,8) (0,2) (0,2) (4,5) Customer deposits (£bn) 145,8 16,1 97,9 26,6 25,2 8,4 9,5 24,2 0,2 353,9 Risk-weighted assets (RWAs) (£bn) 32,7 18,1 78,5 8,6 9,5 35,2 34,5 9,6 1,5 228,2 RWA equivalent (£bn) (5) 35,7 19,5 82,6 8,6 9,5 37,2 37,5 10,1 1,7 242,4 Employee numbers (FTEs - thousands) 18,3 3,1 5,5 1,7 0,8 1,2 0,4 4,5 42,3 77,8 nm = not meaningful For the notes to this table refer to page 23. RBS Group - Q4 2016 Financial Supplement Page 12
 Financial Supplement Page 11 Page 13