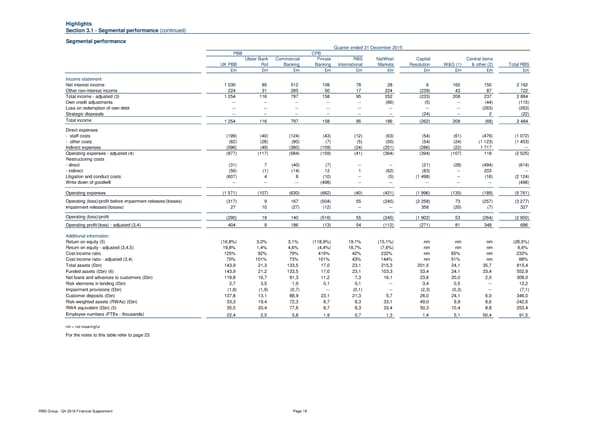
Highlights Section 3.1 - Segmental performance (continued) Segmental performance Quarter ended 31 December 2015 PBB CPB Ulster Bank Commercial Private RBS NatWest Capital Central items UK PBB RoI Banking Banking International Markets Resolution W&G (1) & other (2) Total RBS £m £m £m £m £m £m £m £m £m £m Income statement Net interest income 1 030 85 512 108 78 28 6 165 150 2 162 Other non-interest income 224 31 285 50 17 224 (239) 43 87 722 Total income - adjusted (3) 1 254 116 797 158 95 252 (233) 208 237 2 884 Own credit adjustments -- -- -- -- -- (66) (5) -- (44) (115) Loss on redemption of own debt -- -- -- -- -- -- -- -- (263) (263) Strategic disposals -- -- -- -- -- -- (24) -- 2 (22) Total income 1 254 116 797 158 95 186 (262) 208 (68) 2 484 Direct expenses - staff costs (199) (40) (124) (43) (12) (63) (54) (61) (476) (1 072) - other costs (82) (28) (80) (7) (5) (50) (54) (24) (1 123) (1 453) Indirect expenses (596) (49) (380) (109) (24) (251) (286) (22) 1 717 -- Operating expenses - adjusted (4) (877) (117) (584) (159) (41) (364) (394) (107) 118 (2 525) Restructuring costs - direct (31) 7 (40) (7) -- -- (21) (28) (494) (614) - indirect (56) (1) (14) 12 1 (62) (83) -- 203 -- Litigation and conduct costs (607) 4 8 (10) -- (5) (1 498) -- (16) (2 124) Write down of goodwill -- -- -- (498) -- -- -- -- -- (498) Operating expenses (1 571) (107) (630) (662) (40) (431) (1 996) (135) (189) (5 761) Operating (loss)/profit before impairment releases/(losses) (317) 9 167 (504) 55 (245) (2 258) 73 (257) (3 277) Impairment releases/(losses) 27 10 (27) (12) -- -- 356 (20) (7) 327 Operating (loss)/profit (290) 19 140 (516) 55 (245) (1 902) 53 (264) (2 950) Operating profit/(loss) - adjusted (3,4) 404 9 186 (13) 54 (112) (271) 81 348 686 Additional information Return on equity (5) (16,8%) 3,0% 3,1% (118,9%) 19,1% (15,1%) nm nm nm (26,5%) Return on equity - adjusted (3,4,5) 19,8% 1,4% 4,6% (4,4%) 18,7% (7,6%) nm nm nm 6,6% Cost:income ratio 125% 92% 79% 419% 42% 232% nm 65% nm 232% Cost:income ratio - adjusted (3,4) 70% 101% 73% 101% 43% 144% nm 51% nm 88% Total assets (£bn) 143,9 21,3 133,5 17,0 23,1 215,3 201,5 24,1 35,7 815,4 Funded assets (£bn) (6) 143,9 21,2 133,5 17,0 23,1 103,3 53,4 24,1 33,4 552,9 Net loans and advances to customers (£bn) 119,8 16,7 91,3 11,2 7,3 16,1 23,6 20,0 2,0 308,0 Risk elements in lending (£bn) 2,7 3,5 1,9 0,1 0,1 -- 3,4 0,5 -- 12,2 Impairment provisions (£bn) (1,8) (1,9) (0,7) -- (0,1) -- (2,3) (0,3) -- (7,1) Customer deposits (£bn) 137,8 13,1 88,9 23,1 21,3 5,7 26,0 24,1 6,0 346,0 Risk-weighted assets (RWAs) (£bn) 33,3 19,4 72,3 8,7 8,3 33,1 49,0 9,9 8,6 242,6 RWA equivalent (£bn) (5) 35,5 20,4 77,6 8,7 8,3 33,4 50,3 10,4 8,8 253,4 Employee numbers (FTEs - thousands) 22,4 2,5 5,8 1,9 0,7 1,3 1,4 5,1 50,4 91,5 nm = not meaningful. For the notes to this table refer to page 23. RBS Group - Q4 2016 Financial Supplement Page 18
 Financial Supplement Page 17 Page 19