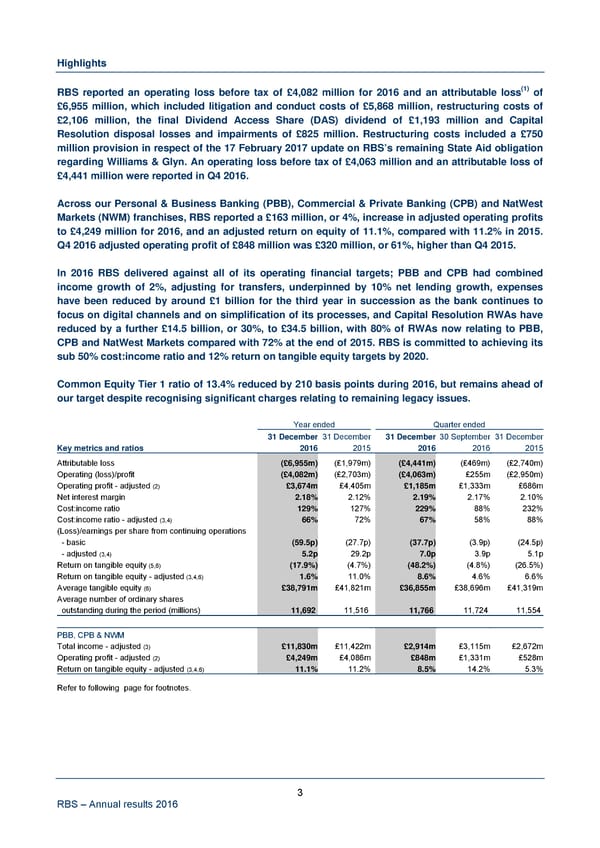
Highlights RBS reported an operating loss before tax of £4,082 million for 2016 and an attributable loss(1) of £6,955 million, which included litigation and conduct costs of £5,868 million, restructuring costs of £2,106 million, the final Dividend Access Share (DAS) dividend of £1,193 million and Capital Resolution disposal losses and impairments of £825 million. Restructuring costs included a £750 million provision in respect of the 17 February 2017 update on RBS’s remaining State Aid obligation regarding Williams & Glyn. An operating loss before tax of £4,063 million and an attributable loss of £4,441 million were reported in Q4 2016. Across our Personal & Business Banking (PBB), Commercial & Private Banking (CPB) and NatWest Markets (NWM) franchises, RBS reported a £163 million, or 4%, increase in adjusted operating profits to £4,249 million for 2016, and an adjusted return on equity of 11.1%, compared with 11.2% in 2015. Q4 2016 adjusted operating profit of £848 million was £320 million, or 61%, higher than Q4 2015. In 2016 RBS delivered against all of its operating financial targets; PBB and CPB had combined income growth of 2%, adjusting for transfers, underpinned by 10% net lending growth, expenses have been reduced by around £1 billion for the third year in succession as the bank continues to focus on digital channels and on simplification of its processes, and Capital Resolution RWAs have reduced by a further £14.5 billion, or 30%, to £34.5 billion, with 80% of RWAs now relating to PBB, CPB and NatWest Markets compared with 72% at the end of 2015. RBS is committed to achieving its sub 50% cost:income ratio and 12% return on tangible equity targets by 2020. Common Equity Tier 1 ratio of 13.4% reduced by 210 basis points during 2016, but remains ahead of our target despite recognising significant charges relating to remaining legacy issues. Year ended Quarter ended 31 December 31 December 31 December 30 September 31 December Key metrics and ratios 2016 2015 2016 2016 2015 Attributable loss (£6,955m) (£1,979m) (£4,441m) (£469m) (£2,740m) Operating (loss)/profit (£4,082m) (£2,703m) (£4,063m) £255m (£2,950m) Operating profit - adjusted (2) £3,674m £4,405m £1,185m £1,333m £686m Net interest margin 2.18% 2.12% 2.19% 2.17% 2.10% Cost:income ratio 129% 127% 229% 88% 232% Cost:income ratio - adjusted (3,4) 66% 72% 67% 58% 88% (Loss)/earnings per share from continuing operations - basic (59.5p) (27.7p) (37.7p) (3.9p) (24.5p) - adjusted (3,4) 5.2p 29.2p 7.0p 3.9p 5.1p Return on tangible equity (5,6) (17.9%) (4.7%) (48.2%) (4.8%) (26.5%) Return on tangible equity - adjusted (3,4,6) 1.6% 11.0% 8.6% 4.6% 6.6% Average tangible equity (6) £38,791m £41,821m £36,855m £38,696m £41,319m Average number of ordinary shares outstanding during the period (millions) 11,692 11,516 11,766 11,724 11,554 PBB, CPB & NWM Total income - adjusted (3) £11,830m £11,422m £2,914m £3,115m £2,672m Operating profit - adjusted (2) £4,249m £4,086m £848m £1,331m £528m Return on tangible equity - adjusted (3,4,6) 11.1% 11.2% 8.5% 14.2% 5.3% Refer to following page for footnotes. 3 RBS – Annual results 2016
 Annual Results Announcement Page 4 Page 6