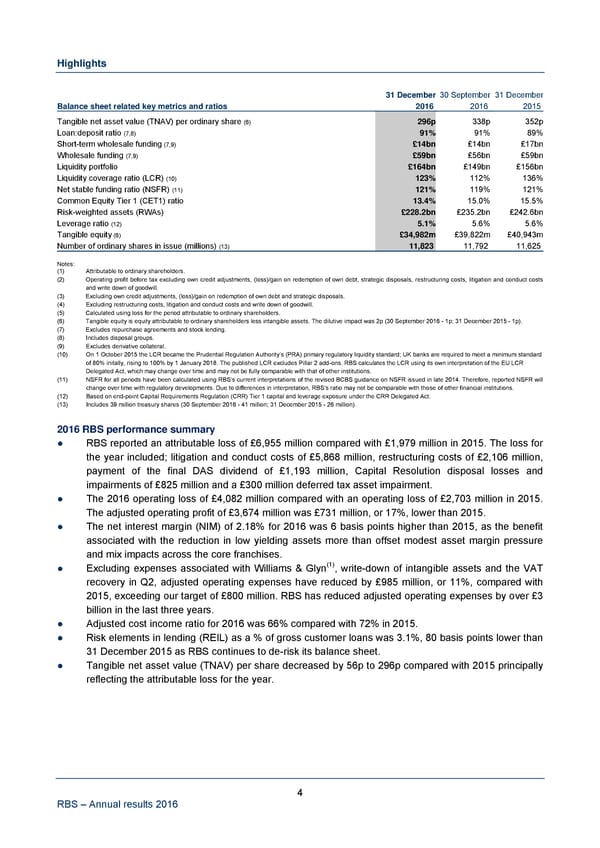
Highlights 31 December 30 September 31 December Balance sheet related key metrics and ratios 2016 2016 2015 Tangible net asset value (TNAV) per ordinary share (6) 296p 338p 352p Loan:deposit ratio (7,8) 91% 91% 89% Short-term wholesale funding (7,9) £14bn £14bn £17bn Wholesale funding (7,9) £59bn £56bn £59bn Liquidity portfolio £164bn £149bn £156bn Liquidity coverage ratio (LCR) (10) 123% 112% 136% Net stable funding ratio (NSFR) (11) 121% 119% 121% Common Equity Tier 1 (CET1) ratio 13.4% 15.0% 15.5% Risk-weighted assets (RWAs) £228.2bn £235.2bn £242.6bn Leverage ratio (12) 5.1% 5.6% 5.6% Tangible equity (6) £34,982m £39,822m £40,943m Number of ordinary shares in issue (millions) (13) 11,823 11,792 11,625 Notes: (1) Attributable to ordinary shareholders. (2) Operating profit before tax excluding own credit adjustments, (loss)/gain on redemption of own debt, strategic disposals, restructuring costs, litigation and conduct costs and write down of goodwill. (3) Excluding own credit adjustments, (loss)/gain on redemption of own debt and strategic disposals. (4) Excluding restructuring costs, litigation and conduct costs and write down of goodwill. (5) Calculated using loss for the period attributable to ordinary shareholders. (6) Tangible equity is equity attributable to ordinary shareholders less intangible assets. The dilutive impact was 2p (30 September 2016 - 1p; 31 December 2015 - 1p). (7) Excludes repurchase agreements and stock lending. (8) Includes disposal groups. (9) Excludes derivative collateral. (10) On 1 October 2015 the LCR became the Prudential Regulation Authority’s (PRA) primary regulatory liquidity standard; UK banks are required to meet a minimum standard of 80% initally, rising to 100% by 1 January 2018. The published LCR excludes Pillar 2 add-ons. RBS calculates the LCR using its own interpretation of the EU LCR Delegated Act, which may change over time and may not be fully comparable with that of other institutions. (11) NSFR for all periods have been calculated using RBS’s current interpretations of the revised BCBS guidance on NSFR issued in late 2014. Therefore, reported NSFR will change over time with regulatory developments. Due to differences in interpretation, RBS’s ratio may not be comparable with those of other financial institutions. (12) Based on end-point Capital Requirements Regulation (CRR) Tier 1 capital and leverage exposure under the CRR Delegated Act. (13) Includes 39 million treasury shares (30 September 2016 - 41 million; 31 December 2015 - 26 million). 2016 RBS performance summary ● RBS reported an attributable loss of £6,955 million compared with £1,979 million in 2015. The loss for the year included; litigation and conduct costs of £5,868 million, restructuring costs of £2,106 million, payment of the final DAS dividend of £1,193 million, Capital Resolution disposal losses and impairments of £825 million and a £300 million deferred tax asset impairment. ● The 2016 operating loss of £4,082 million compared with an operating loss of £2,703 million in 2015. The adjusted operating profit of £3,674 million was £731 million, or 17%, lower than 2015. ● The net interest margin (NIM) of 2.18% for 2016 was 6 basis points higher than 2015, as the benefit associated with the reduction in low yielding assets more than offset modest asset margin pressure and mix impacts across the core franchises. ● Excluding expenses associated with Williams & Glyn(1), write-down of intangible assets and the VAT recovery in Q2, adjusted operating expenses have reduced by £985 million, or 11%, compared with 2015, exceeding our target of £800 million. RBS has reduced adjusted operating expenses by over £3 billion in the last three years. ● Adjusted cost income ratio for 2016 was 66% compared with 72% in 2015. ● Risk elements in lending (REIL) as a % of gross customer loans was 3.1%, 80 basis points lower than 31 December 2015 as RBS continues to de-risk its balance sheet. ● Tangible net asset value (TNAV) per share decreased by 56p to 296p compared with 2015 principally reflecting the attributable loss for the year. 4 RBS – Annual results 2016
 Annual Results Announcement Page 5 Page 7