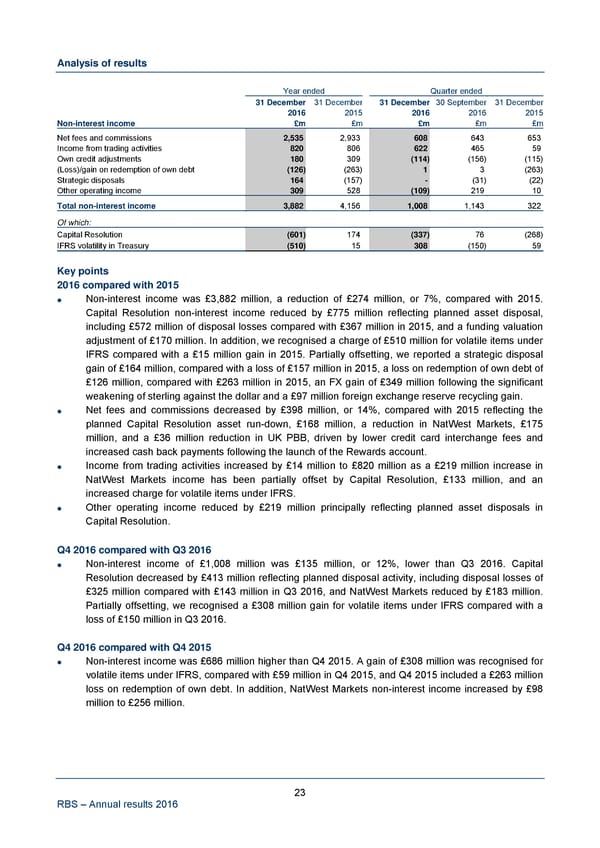
Analysis of results Year ended Quarter ended 31 December 31 December 31 December 30 September 31 December 2016 2015 2016 2016 2015 Non-interest income £m £m £m £m £m Net fees and commissions 2,535 2,933 608 643 653 Income from trading activities 820 806 622 465 59 Own credit adjustments 180 309 (114) (156) (115) (Loss)/gain on redemption of own debt (126) (263) 1 3 (263) Strategic disposals 164 (157) - (31) (22) Other operating income 309 528 (109) 219 10 Total non-interest income 3,882 4,156 1,008 1,143 322 Of which: Capital Resolution (601) 174 (337) 76 (268) IFRS volatility in Treasury (510) 15 308 (150) 59 Key points 2016 compared with 2015 Non-interest income was £3,882 million, a reduction of £274 million, or 7%, compared with 2015. Capital Resolution non-interest income reduced by £775 million reflecting planned asset disposal, including £572 million of disposal losses compared with £367 million in 2015, and a funding valuation adjustment of £170 million. In addition, we recognised a charge of £510 million for volatile items under IFRS compared with a £15 million gain in 2015. Partially offsetting, we reported a strategic disposal gain of £164 million, compared with a loss of £157 million in 2015, a loss on redemption of own debt of £126 million, compared with £263 million in 2015, an FX gain of £349 million following the significant weakening of sterling against the dollar and a £97 million foreign exchange reserve recycling gain. Net fees and commissions decreased by £398 million, or 14%, compared with 2015 reflecting the planned Capital Resolution asset run-down, £168 million, a reduction in NatWest Markets, £175 million, and a £36 million reduction in UK PBB, driven by lower credit card interchange fees and increased cash back payments following the launch of the Rewards account. Income from trading activities increased by £14 million to £820 million as a £219 million increase in NatWest Markets income has been partially offset by Capital Resolution, £133 million, and an increased charge for volatile items under IFRS. Other operating income reduced by £219 million principally reflecting planned asset disposals in Capital Resolution. Q4 2016 compared with Q3 2016 Non-interest income of £1,008 million was £135 million, or 12%, lower than Q3 2016. Capital Resolution decreased by £413 million reflecting planned disposal activity, including disposal losses of £325 million compared with £143 million in Q3 2016, and NatWest Markets reduced by £183 million. Partially offsetting, we recognised a £308 million gain for volatile items under IFRS compared with a loss of £150 million in Q3 2016. Q4 2016 compared with Q4 2015 Non-interest income was £686 million higher than Q4 2015. A gain of £308 million was recognised for volatile items under IFRS, compared with £59 million in Q4 2015, and Q4 2015 included a £263 million loss on redemption of own debt. In addition, NatWest Markets non-interest income increased by £98 million to £256 million. 23 RBS – Annual results 2016
 Annual Results Announcement Page 27 Page 29