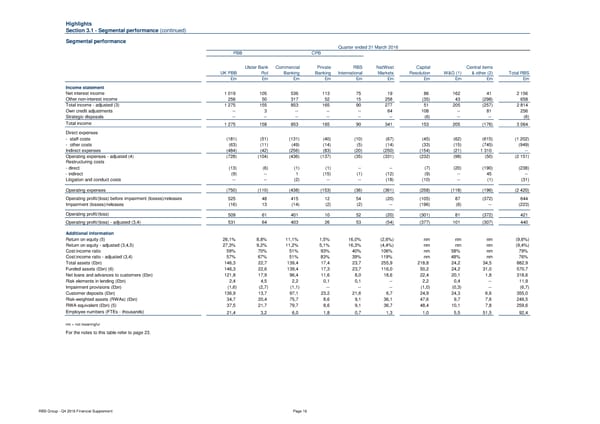
Highlights Section 3.1 - Segmental performance (continued) Segmental performance Quarter ended 31 March 2016 PBB CPB Ulster Bank Commercial Private RBS NatWest Capital Central items UK PBB RoI Banking Banking International Markets Resolution W&G (1) & other (2) Total RBS £m £m £m £m £m £m £m £m £m £m Income statement Net interest income 1 019 105 536 113 75 19 86 162 41 2 156 Other non-interest income 256 50 317 52 15 258 (35) 43 (298) 658 Total income - adjusted (3) 1 275 155 853 165 90 277 51 205 (257) 2 814 Own credit adjustments -- 3 -- -- -- 64 108 -- 81 256 Strategic disposals -- -- -- -- -- -- (6) -- -- (6) Total income 1 275 158 853 165 90 341 153 205 (176) 3 064 Direct expenses - staff costs (181) (51) (131) (40) (10) (67) (45) (62) (615) (1 202) - other costs (63) (11) (49) (14) (5) (14) (33) (15) (745) (949) Indirect expenses (484) (42) (256) (83) (20) (250) (154) (21) 1 310 -- Operating expenses - adjusted (4) (728) (104) (436) (137) (35) (331) (232) (98) (50) (2 151) Restructuring costs - direct (13) (6) (1) (1) -- -- (7) (20) (190) (238) - indirect (9) -- 1 (15) (1) (12) (9) -- 45 -- Litigation and conduct costs -- -- (2) -- -- (18) (10) -- (1) (31) Operating expenses (750) (110) (438) (153) (36) (361) (258) (118) (196) (2 420) Operating profit/(loss) before impairment (losses)/releases 525 48 415 12 54 (20) (105) 87 (372) 644 Impairment (losses)/releases (16) 13 (14) (2) (2) -- (196) (6) -- (223) Operating profit/(loss) 509 61 401 10 52 (20) (301) 81 (372) 421 Operating profit/(loss) - adjusted (3,4) 531 64 403 26 53 (54) (377) 101 (307) 440 Additional information Return on equity (5) 26,1% 8,8% 11,1% 1,5% 16,0% (2,6%) nm nm nm (9,6%) Return on equity - adjusted (3,4,5) 27,3% 9,2% 11,2% 5,1% 16,3% (4,4%) nm nm nm (9,4%) Cost:income ratio 59% 70% 51% 93% 40% 106% nm 58% nm 79% Cost:income ratio - adjusted (3,4) 57% 67% 51% 83% 39% 119% nm 48% nm 76% Total assets (£bn) 146,3 22,7 139,4 17,4 23,7 255,9 218,8 24,2 34,5 882,9 Funded assets (£bn) (6) 146,3 22,6 139,4 17,3 23,7 116,0 50,2 24,2 31,0 570,7 Net loans and advances to customers (£bn) 121,8 17,9 96,4 11,6 8,0 18,6 22,4 20,1 1,8 318,6 Risk elements in lending (£bn) 2,4 4,5 2,2 0,1 0,1 -- 2,2 0,4 -- 11,9 Impairment provisions (£bn) (1,6) (2,7) (1,1) -- -- -- (1,0) (0,3) -- (6,7) Customer deposits (£bn) 136,9 13,7 97,1 23,2 21,6 6,7 24,9 24,3 6,6 355,0 Risk-weighted assets (RWAs) (£bn) 34,7 20,4 75,7 8,6 9,1 36,1 47,6 9,7 7,6 249,5 RWA equivalent (£bn) (5) 37,5 21,7 79,7 8,6 9,1 36,7 48,4 10,1 7,8 259,6 Employee numbers (FTEs - thousands) 21,4 3,2 6,0 1,8 0,7 1,3 1,0 5,5 51,5 92,4 nm = not meaningful For the notes to this table refer to page 23. RBS Group - Q4 2016 Financial Supplement Page 16
 Financial Supplement Page 15 Page 17